
Advertisement
Advertisement
Natural Gas Surges: Bullish Momentum Sparks Uptrend Resurgence
By:
Navigating the rally, indicators point to a strong comeback for natural gas, breaking through key levels and setting the stage for higher targets and sustained momentum.

In this article:
Natural Gas Forecast Video for 14.11.23 by Bruce Powers
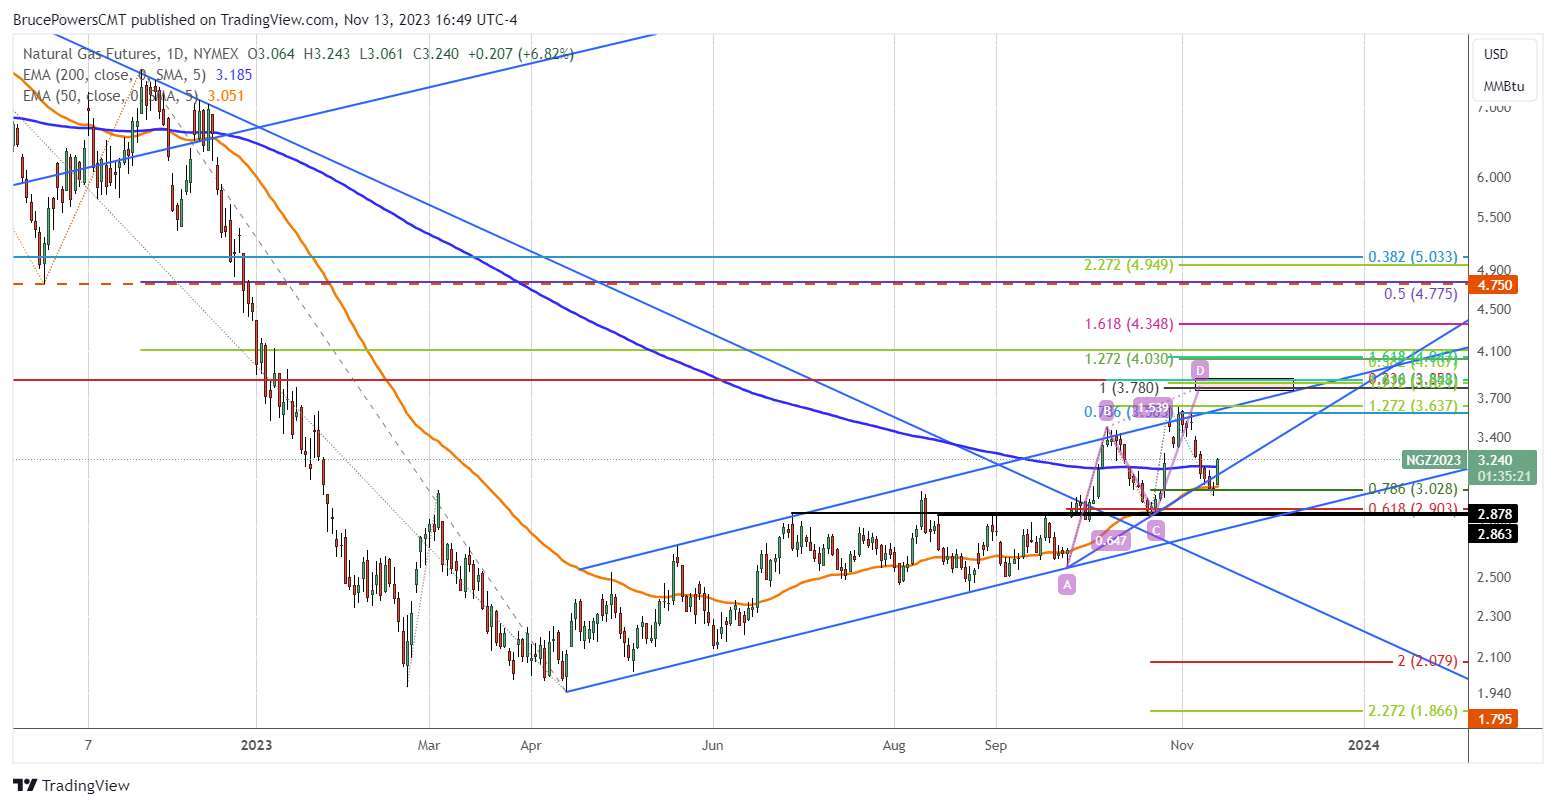
Natural gas triggered a bullish reversal today as it rallied above yesterday’s high of 3.08 and kept rising to a four-day high. Upward momentum has kicked in leading to a wide range green candlestick. The advance comes off a support zone with a low of 2.99, utilizing the combination of the internal uptrend line, the 78.6% Fibonacci retracement, and the 50-Day EMA (orange).
Strength Kicks in Today
Today’s rally is similar in scope to what was seen in the last two rallies, starting from October 3. The bullish reaction is exactly what the bulls will want to see to indicate that the retracement is likely over, and the uptrend can continue. Further evidence of strength is seen in the relationship with the 200-Day EMA, now at 3.185. Today’s advance has taken natural gas through the 200-Day line, and it is on track to close above it.
Retaining Support of 50-Day EMA Key to Bullish Outlook
Retaining support of the 50-Day line was key to confirming the increased angle of ascent as seen with the internal uptrend line. The prior slope of the trend is indicated by the lower uptrend line. More aggressive buying began following the gap up on September 27. It would help to reach higher prices if this accelerated slope is sustained. Today’s price action indicates that it might be, in which case higher targets come into play.
Weekly High of 3.41 Next Key Target
The next key price level is last week’s high of 3.41. A daily close above that high will further confirm strength of the uptrend as it breaks above the week’s high and puts natural gas back above its 50-Week EMA at 3.33. The trend high of 3.64 will then be in sight. Higher target prices start around 3.78. A resistance range starts from that level and goes up to around 3.85. The higher price level completes the 23.6% Fibonacci retracement of the full downtrend. The fact that natural gas has not yet risen to that low level Fibonacci retracement points to the difficulty natural gas has had in strengthening, following a significant selloff that ended with April trend low.
For a look at all of today’s economic events, check out our economic calendar.
About the Author
Bruce Powersauthor
Bruce boasts over 20 years in financial markets, holding senior roles such as Head of Trading Strategy at Relentless 13 Capital and Corporate Advisor at Chronos Futures. A CMT® charter holder and MBA in Finance, he's a renowned analyst and media figure, appearing on 150+ TV business shows.
Did you find this article useful?
Latest news and analysis


Advertisement