
Advertisement
Advertisement
Natural Gas Outlook: Testing Support Levels Amid a Deeper Retracement
By:
Natural gas faces a critical test at the 78.6% retracement, with a minor bounce offering hope. Caution persists as signs of a bullish reversal remain elusive.

In this article:
Natural Gas Forecast Video for 10.11.23 by Bruce Powers
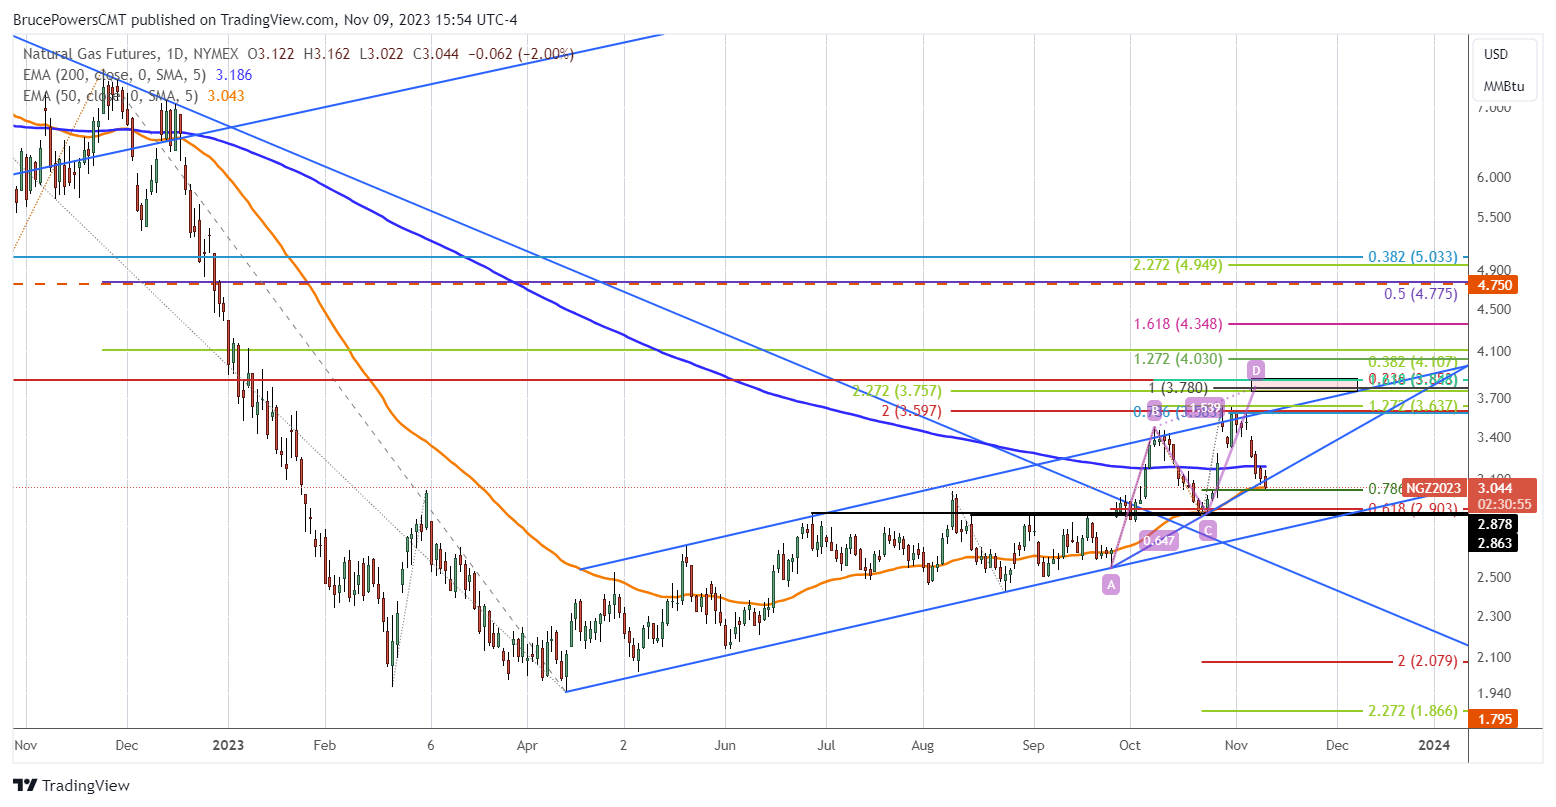
Natural gas falls to test support around the 78.6% Fibonacci retracement. The descent stopped at a low of 3.02, leading to a minor bounce. This is an area where natural gas should see strong support if it retains a bullish outlook in the bigger picture. There is no sign of that yet as it has stopped at the support zone but has not yet turned up if it is to do so. Downward pressure remains as natural gas is still trading near the lows of the day at the time of this writing.
Referencing Initial Rallies as a Model
The previous retracement from the October 9 swing high reversed off the 61.8% Fibonacci retracement level and led to the October 27 swing high. We are seeing stronger signs of weakness now given the deeper retracement to the 78.6% level. This is a sign to be cautious currently. A bullish reversal is expected from today’s low but there needs to be indications for it first. Signs of strength would first be seen on an advance above today’s high of 3.16, and further still on a rally above the two-day high at 3.19.
Testing Support at 50-Day EMA
Today’s low tested support of the 50-Day EMA as well at 3.04. It was a sign of strengthening when natural gas successfully tested the 50-Day line as support on October 23 and then rallied sharply. Since the 50-Day line is a trending indicator it is more useful in trending markets than choppy markets. The test as support is a sign that natural gas may be moving from a largely consolidating market to a trending market. You can see how prices were up and down around the 50-Day EMA for months prior to the most recent upside breakout on September 27.
Weekly and Monthly Levels May Provide Support
It is worth noting that last month’s low was at 2.82 and there is prior support from two weekly lows at 2.86 and 2.88 and 2.86. If today’s low is broken and natural gas continues to correct the 2.82 and 2.86 price area is where support may subsequently be seen. It looks like natural gas may close below both the internal uptrend line and 50-Day EMA, which shows weakness. However, what happens next will be telling. If a continuation of the retracement occurs, then the strong upward momentum seen in the last two advances may be gone.
For a look at all of today’s economic events, check out our economic calendar.
About the Author
Bruce Powersauthor
Bruce boasts over 20 years in financial markets, holding senior roles such as Head of Trading Strategy at Relentless 13 Capital and Corporate Advisor at Chronos Futures. A CMT® charter holder and MBA in Finance, he's a renowned analyst and media figure, appearing on 150+ TV business shows.
Did you find this article useful?
Latest news and analysis


Advertisement