- The WTI barrel price declined by more than 2% to $80.70.
- The US reported soft labor market figures.
- Tensions in the Middle East are easing, favouring the price to decline.
At the end of the week, the West Texas Intermediate (WTI) barrel is seeing sharp losses, mainly due to worries on the US economy, the largest Oil consumer, after the release of weak labor and economic activity data. In addition, as the Middle East tensions ease, markets are confident that there won't be any supply or demand disruptions also contributing to the downward movements.
The US Bureau of Labor Statistics revealed disappointing numbers, as job additions for October from the US economy fell short of expectations at 150,000 vs the 180,000 expected and decelerated from its revised previous figure of 297,000. In addition, the Unemployment Rate rose to 3.9%, above the expected 3.8% while the Average Hourly Earnings increased by 0.2% MoM, lower than the projections and tallied a 4.1% YoY increase. In line with that, if the US continues to reveal that its economy is weakening and that the cumulative effects of the monetary policy are kicking in just now, Oil prices could face further downside as lower energy would be demanded from the largest consumer in the world.
On the positive side, as the Federal Reserve (Fed) approaches the end of its tightening cycle, it would be beneficial for the WTI price as higher rates tend to be negatively correlated with energy demand. In that sense, the market focus shifts to the next reports ahead of the next Fed meeting in December, including two additional inflation readings and a job report.
WTI Levels to watch
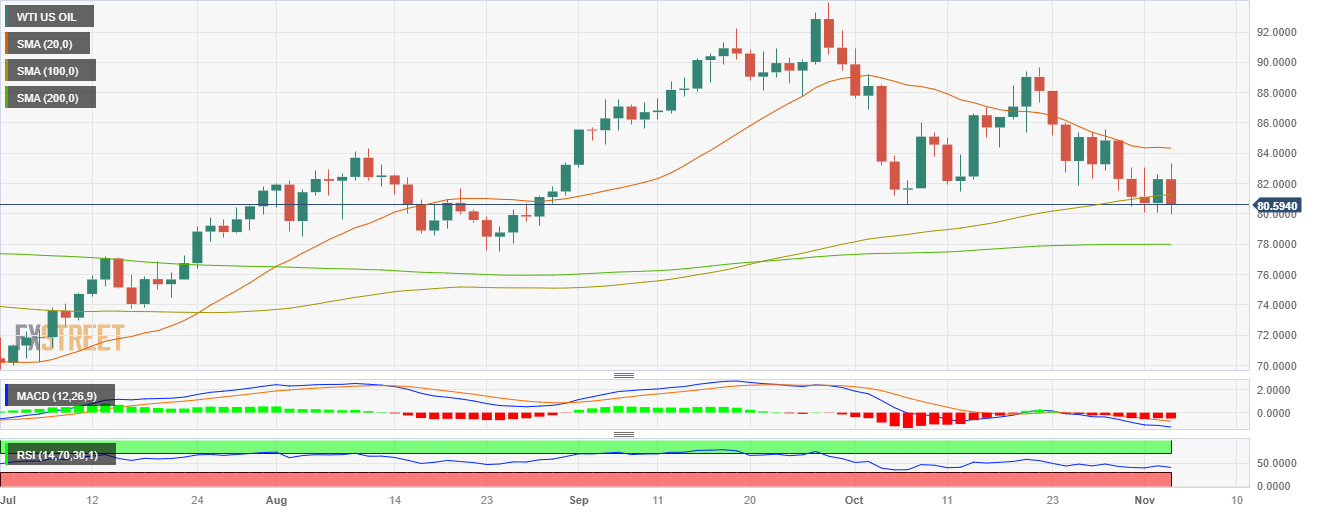
Upon evaluating the daily chart, a neutral to bearish outlook is seen for the WTI, with the balance starting to lean in favour of the bears, although they still have some work to do.The Relative Strength Index (RSI) has a negative slope below its midline, while the Moving Average Convergence (MACD) displays neutral red bars. In addition, the price has fallen below the 20 and 100-day Simple Moving Averages (SMA), which seem to be converging towards the $83.00 area to perform a bearish cross, which would likely trigger further downside for the WTI in the short term.
Support levels: $80.50, $80.30, $80.00.
Resistance levels: $81.60 (100-day SMA), $82.80, $83.50
WTI Daily Chart
Information on these pages contains forward-looking statements that involve risks and uncertainties. Markets and instruments profiled on this page are for informational purposes only and should not in any way come across as a recommendation to buy or sell in these assets. You should do your own thorough research before making any investment decisions. FXStreet does not in any way guarantee that this information is free from mistakes, errors, or material misstatements. It also does not guarantee that this information is of a timely nature. Investing in Open Markets involves a great deal of risk, including the loss of all or a portion of your investment, as well as emotional distress. All risks, losses and costs associated with investing, including total loss of principal, are your responsibility. The views and opinions expressed in this article are those of the authors and do not necessarily reflect the official policy or position of FXStreet nor its advertisers. The author will not be held responsible for information that is found at the end of links posted on this page.
If not otherwise explicitly mentioned in the body of the article, at the time of writing, the author has no position in any stock mentioned in this article and no business relationship with any company mentioned. The author has not received compensation for writing this article, other than from FXStreet.
FXStreet and the author do not provide personalized recommendations. The author makes no representations as to the accuracy, completeness, or suitability of this information. FXStreet and the author will not be liable for any errors, omissions or any losses, injuries or damages arising from this information and its display or use. Errors and omissions excepted.
The author and FXStreet are not registered investment advisors and nothing in this article is intended to be investment advice.
Recommended content
Editors’ Picks
EUR/USD drops below 1.0850, focus shifts to US ISM PMI

EUR/USD is on the defensive below 1.0850 in the European session on Monday. A broad-based US Dollar rebound acts as a headwind to the pair, as attention turns toward the US ISM PMI due later in the American morning.
GBP/USD stays weak near 1.2700 ahead of US ISM PMI

GBP/USD is under moderate selling pressure near 1.2700 in the European trading hours on Monday. A modest US Dollar uptick weighs on the pair, despite an upbeat mood. Investors await the US ISM Manufacturing PMI data for fresh guidance.
Gold rolls over, failing to sustain PCE-related spike

Gold (XAU/USD) slides lower to trade in the $2,320s on Monday as a positive risk-on environment inherited from the Asian session lowers safe-haven demand for the metal.
Top 3 Price Prediction Bitcoin, Ethereum, Ripple: Bitcoin’s momentum poise to propel crypto market

Bitcoin price consolidates in a symmetrical triangle pattern, showing directional bias. Ripple also follows BTC’s footsteps as it continues on its 50-day consolidation streak. Ethereum price, on the other hand, shows signs of an incoming correction.
Bumper week of event risk ahead

Featuring two central bank updates – the Bank of Canada and the European Central Bank – a slew of job numbers out of the US and Aussie GDP growth data, the first full week of June is poised to be eventful.