
Advertisement
Advertisement
Natural Gas Surge: Key Levels and Potential for a Bullish Trend Continuation
By:
With natural gas showing signs of strength, a close above today's high could mark the continuation of a bullish trend. Targets include 3.02 and even 3.18, with strong demand supporting the ascent.

In this article:
Natural Gas Forecast Video for 29.09.23 by Bruce Powers
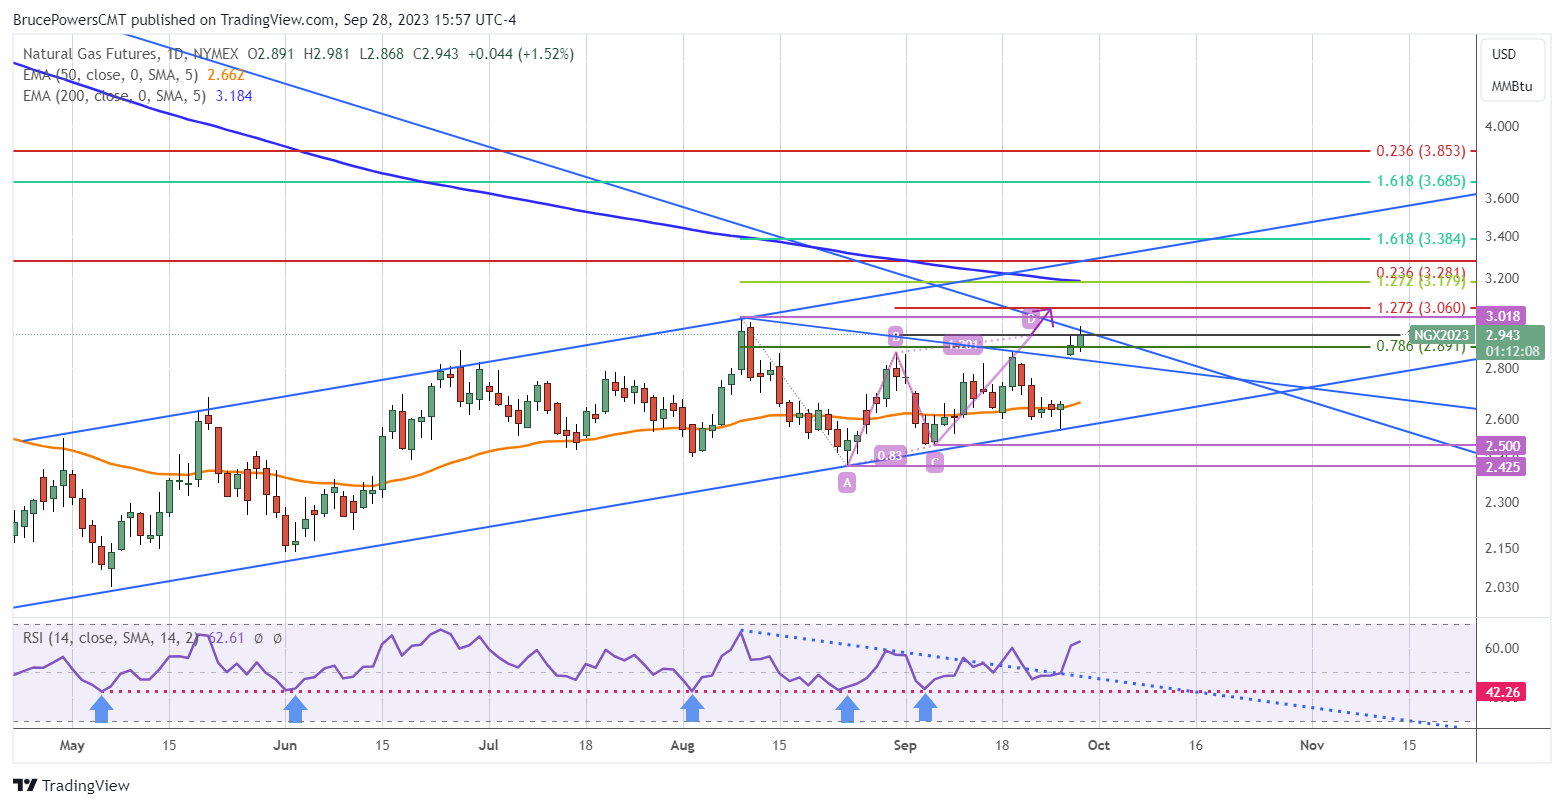
Natural gas continued its ascent today with a rally above yesterday’s high of 2.95. Yesterday, it broke out above the prior swing high at 2.87 and then closed above that price level to confirm strength. Resistance was subsequently encountered today around the long-term downtrend line, leading to a pullback. It is not surprising to see some resistance around the line given its long-term nature and the fact that upward momentum started way lower two days ago. During that short time, it has advanced as much as 16.8% as of today’s high of 2.98.
Watching Today’s Close for Clues Near Term
In the near-term we’ll be watching for where natural gas closes today, relative to the day’s range. Basically, the higher the close relative to the range, the stronger the close. The stronger the close the better the chance of continuing higher in the near-term. A weak close may point to a deeper retracement from today’s high resistance. The halfway point of today’s range of 2.87 to 2.98 is 2.92. Simply, a close above the 50% level is stronger than a close below it. Concurrently, a daily close in the top third or quarter of the day’s range shows greater strength/higher demand.
Continuation of Rally First Targets 3.02
Nonetheless, a breakout above today’s high signals a possible bullish continuation, while a daily close above it will confirm the continuation of the rising trend. There are then several target levels in play. The first is the 3.02 swing high from August 9. If that price level is exceeded to the upside natural gas will then have a chance of reaching the completion of an extended ABCD pattern at 3.06. That’s where the CD leg of the ascent is 127.2% of the AB leg. Subsequently, if natural gas can keep rising it heads towards the 200-Day EMA at 3.18. The 3.18 level is confirmed by the 127.2% Fibonacci retracement of the correction begun from the August 9 swing high, which identifies the same level.
Slingshot Type Price Action on Weekly Chart
That higher price level has a chance of being reached. Natural gas is coming out of a slingshot type setup, best seen on the weekly chart. A bearish signal occurred first, early this week, as natural gas fell below last week’s low. Last week’s candle was a bearish inverted hammer and should lead to further selling once triggered. Instead, demand was strong enough to trigger a weekly bullish reversal and quickly reached a seven-week high. Such strong demand is not likely to go away so quickly, in just a few days.
For a look at all of today’s economic events, check out our economic calendar.
About the Author
Bruce Powersauthor
Bruce boasts over 20 years in financial markets, holding senior roles such as Head of Trading Strategy at Relentless 13 Capital and Corporate Advisor at Chronos Futures. A CMT® charter holder and MBA in Finance, he's a renowned analyst and media figure, appearing on 150+ TV business shows.
Did you find this article useful?
Latest news and analysis


Advertisement