
Advertisement
Advertisement
Natural Gas Surges, Confirms Breakout, but Can It Sustain Momentum?
By:
Natural gas experiences a surge, validating a breakout above the 2.87 swing high, accompanied by bullish signals.

In this article:
Natural Gas Forecast Video for 28.09.23 by Bruce Powers
Natural gas rockets higher with a large gap at the open and subsequent higher prices. The advance follows a bullish hammer candlestick pattern yesterday that marked the bottom of the recent correction. Today’s rally easily took natural gas back above the 2.87 swing high and it is on track to close above it thereby confirming the breakout. In addition, it is back above the internal downtrend line marking dynamic resistance of the recent retracement, an additional sign of strength.
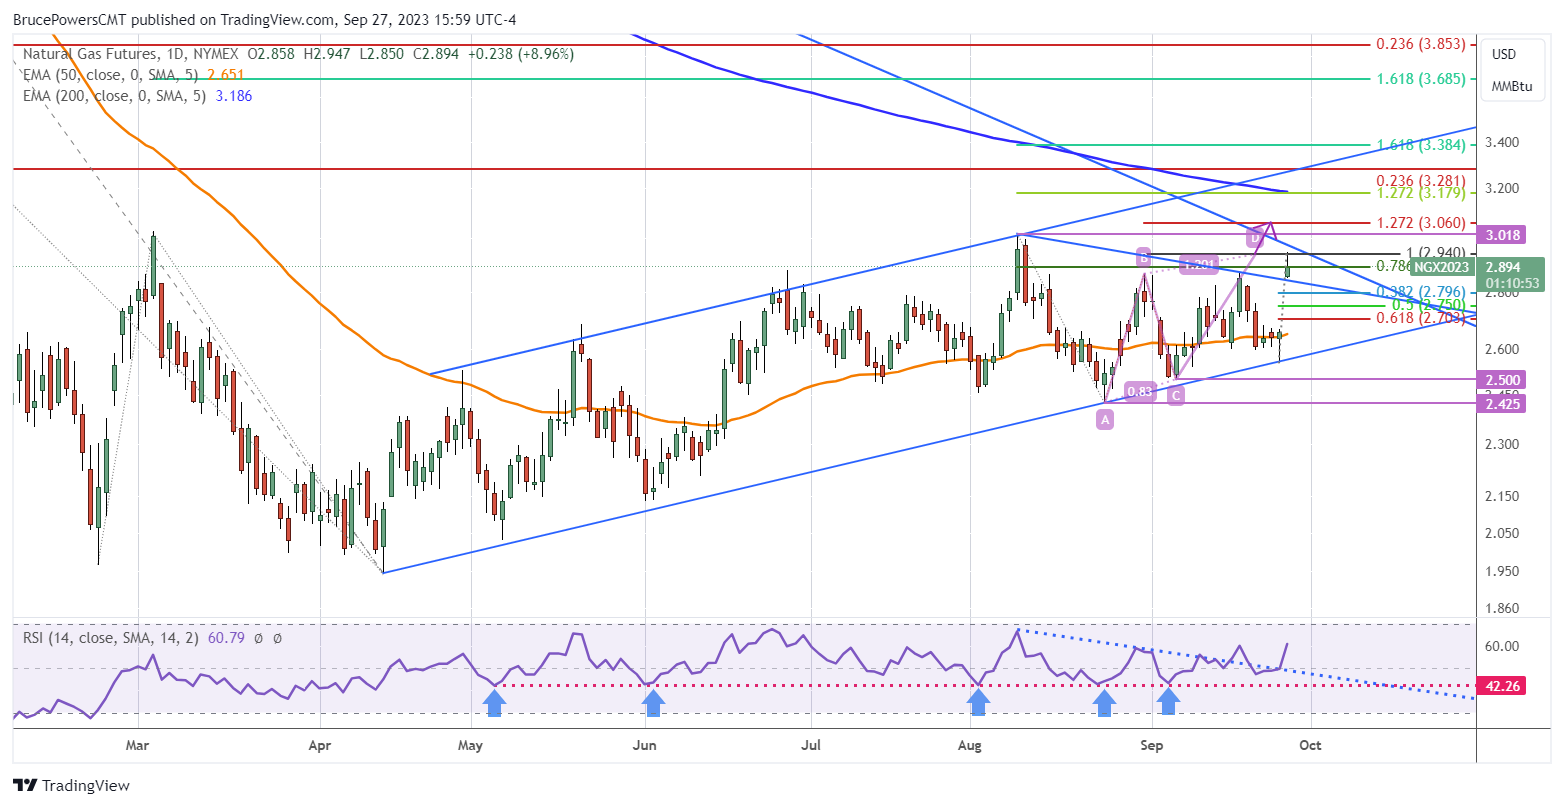
Backs off After Reaching 2.95 Target Zone
The high of 2.95 today completed the first rising ABCD pattern target at 2.94 (D) where the CD leg of the advance matches the price appreciation seen in the AB leg. Once the target was reached, a pullback followed with natural gas looking like it may close weaker than it might, in the lower half of the day’s range. This shows bullish momentum backing off after just one day. Therefore, the rally might be done for now, with natural gas retracing or consolidating while it sets up to make another run higher. A drop below today’s low of 2.85 points to a retracement.
Trendline Support?
How price behaves around potential support of the downtrend line will be telling. Will it act as support, or will the retracement fall below the line? It was resistance and it will be tested as support. Price behavior will be more bullish if it can stay above the line. If it falls below the line potential support levels are marked by Fibonacci retracement levels on the chart.
Higher Targets Start with 3.02
Once natural gas is ready to continue higher, and it could quickly rally above today’s high, it would next be targeting the 3.02 swing high from early August. Subsequently, the 127.2% extended target from the rising ABCD pattern is at 3.06. Further still is the 200-Day EMA (blue), currently at 3.19. Note that the 200-Day line matches a 127.2% Fibonacci extension of the downswing off the early-August swing high. When two target levels match or are close it seems to attract price. This may also be the case here with natural gas. Certainly, the possibility of an eventual rally to the 200-Day line is stronger after today.
For a look at all of today’s economic events, check out our economic calendar.
About the Author
Bruce Powersauthor
Bruce boasts over 20 years in financial markets, holding senior roles such as Head of Trading Strategy at Relentless 13 Capital and Corporate Advisor at Chronos Futures. A CMT® charter holder and MBA in Finance, he's a renowned analyst and media figure, appearing on 150+ TV business shows.
Did you find this article useful?
Latest news and analysis


Advertisement