
Advertisement
Advertisement
Natural Gas Analysis: Bearish Momentum vs. Bullish Reversal Potential
By:
Natural gas faces bearish headwinds with today's drop, but a potential bullish reversal is on the horizon, as key support levels come into play.

In this article:
Natural Gas Forecast Video for 07.09.23 by Bruce Powers
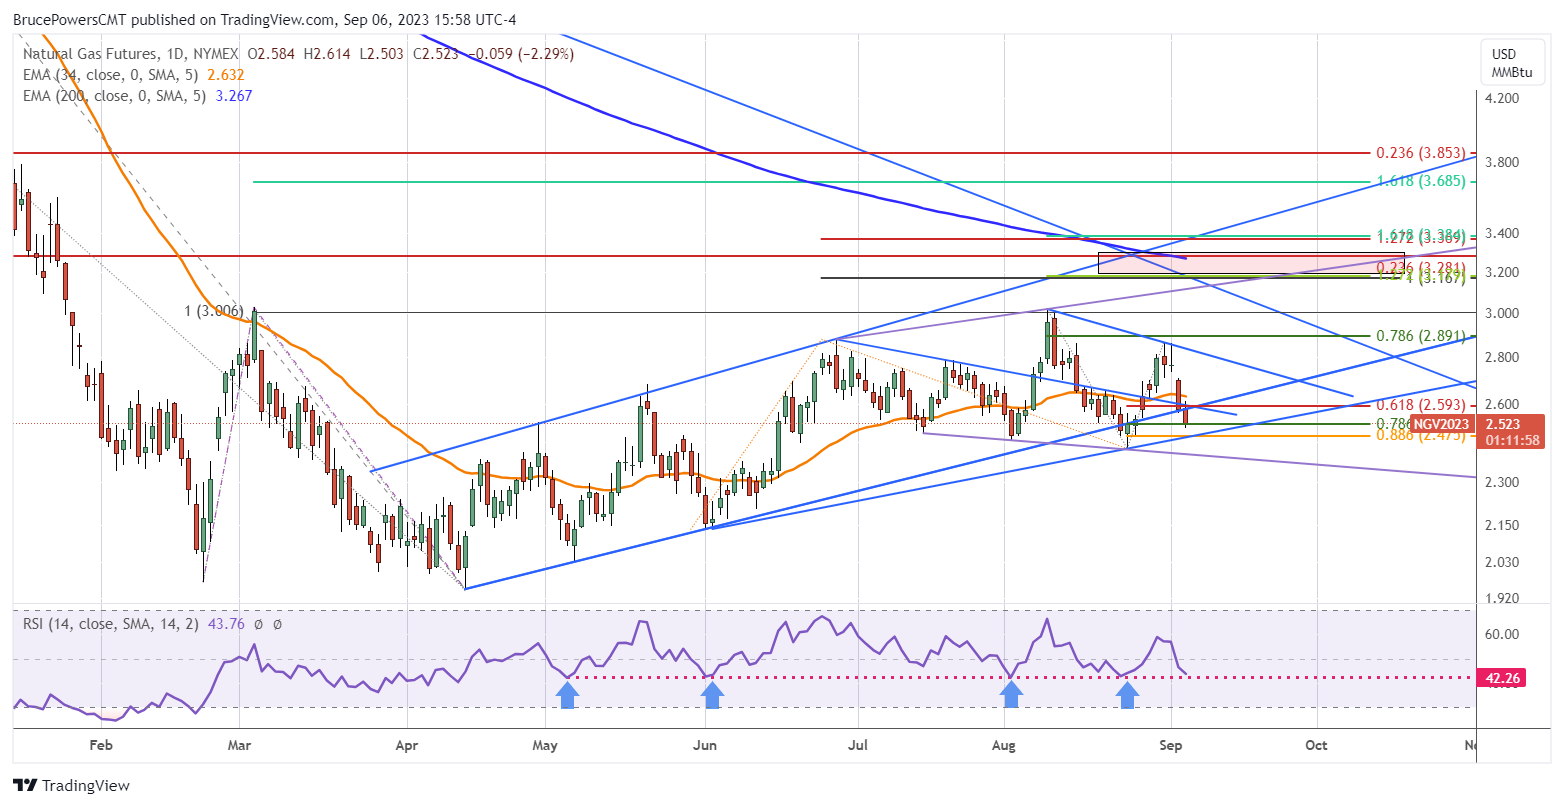
A bear trend continuation triggered on today’s drop below yesterday’s low of 2.57, leading to the day’s low of 2.50. On the way down a 78.6% Fibonacci retracement completed at 2.52. At the time of this writing, natural gas is sitting around support of the 78.6% retracement area.
Technical Damage Done Today
Some technical damage has been done today. Today’s decline brought natural gas back below the internal uptrend line and it is on track to close below the line. Further, on a weekly chart, a bearish signal triggered today as last week’s low around 2.54 was exceeded to the downside. The bearish signal will be confirmed on a daily close below 2.54. Nevertheless, the lower uptrend line, which represents potential support, is not much lower, coming in around 2.48 or higher, depending on when natural gas hits it. Close by currently is the 88.6% Fibonacci retracement at 2.475.
Pattern of Higher Swing Lows at Risk
As long as the swing low of the current retracement reverses off a support level that is higher than the prior swing low of 2.425 from August 24, a bullish outlook for natural gas remains. The retracement low would have a higher swing low than the prior swing low. Ideally for the bulls that happens at a price higher than the 88.6% level. After today the lower uptrend line will be representing support at a higher level given the ascending nature of the trendline.
Potential for a Broadening Formation to Play Out
An alternative scenario is that natural gas is tracing out a broadening formation. The lower boundary of the formation is marked with a declining purple trendline beginning from the July 17 swing low. If a broadening formation continues to form support and a bullish reversal would be seen below the August 24 swing low and at or above the lower boundary line. Stops for long positions would likely be triggered on a drop below the August swing low thereby setting the stage for a bullish reversal off the bottom of the broadening formation. The expectation would then be for a rally that eventually exceeds the August 9 swing high of 3.02 as natural gas heads towards the top of the broadening formation (purple).
For a look at all of today’s economic events, check out our economic calendar.
About the Author
Bruce Powersauthor
Bruce boasts over 20 years in financial markets, holding senior roles such as Head of Trading Strategy at Relentless 13 Capital and Corporate Advisor at Chronos Futures. A CMT® charter holder and MBA in Finance, he's a renowned analyst and media figure, appearing on 150+ TV business shows.
Did you find this article useful?
Latest news and analysis


Advertisement