Since Russian supply cuts started in summer 2021 the European gas market has been at the centre of energy market radar screens.
European demand for incremental LNG to replace Russian gas has sparked a global wave of investment in new supply. European gas market flexibility is also playing a key role clearing the global gas market and driving LNG prices.
Big swings in gas prices in 2023 are feeding directly into price moves across European power markets. Gas fired generation as the dominant price setting fuel is driving both the level of power prices (important for RES & nuclear asset returns) and the level of power price volatility (important for the returns on flexible assets such as batteries, peakers, hydro & interconnectors).
12 months after the peak of Europe’s energy crisis late last summer, the current market set up could not be more different from expectations a year ago.
In today’s article we look at 5 charts to set out the ‘state of play’ in our first feature article after the summer break.
1. A gas curve in two parts
A year ago next week marks the anniversary of Europe’s benchmark TTF price smashing all records. Winter 2023-24 prices hit a high of 280 €/MWh. Since then they have fallen more than 80% to just over 50 €/MWh. Power prices have fallen proportionally.
Chart 1 shows the evolution of TTF spot prices and the forward curve across 2023.
Chart 1: TTF forward curve evolution across 2023
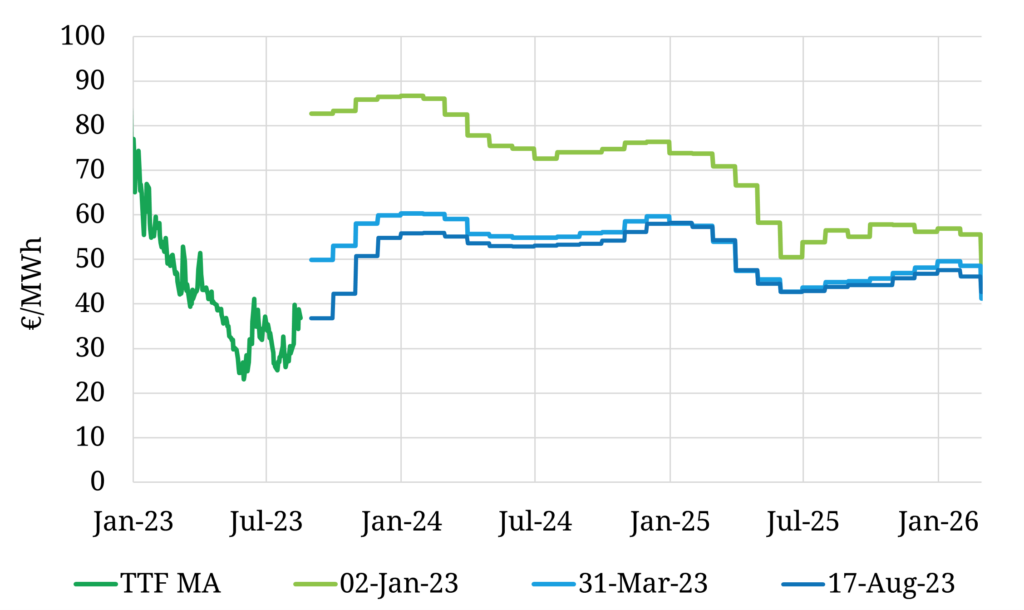
Source: Timera Energy, ICE
Let’s start with 5 takeaways to summarise what has happened to prices in 2023 before we dig into the drivers behind these moves:
- Gas prices were already falling sharply as we entered 2023
- The whole curve continued to fall across Q1 2023 as the crisis eased (mild winter, soft demand, high LNG imports) – see green line to dark blue curve shift in the chart
- In Q2 & Q3 2023 prices at the front of the TTF curve (Summer 2023) have fallen sharply; despite this, prices for Winter 23-24 out to 2025 have been relatively resilient – see dark blue to light blue curve shift
- The Summer 2023 price fall has driven a record contango (rising curve steepness) into winter e.g. Sep vs Nov prices
- Price volatility in the front of the forward curve has been increasing across the last couple of months, particularly across the remainder of 2023 – this has fed through into big swings in power prices.
Now let’s look at the state of some of the key fundamental drivers behind this market behaviour.
2. European Demand down ~20% vs pre-crisis
The energy crisis has precipitated a substantial & rapid decline in European gas demand, beyond all expectations last year.
Chart 2 shows the evolution of European gas demand across 2022 & 2023, relative to the average of the 3 years preceding the crisis (2019-21).
Chart 2: Evolution of European gas demand relative to pre-crisis average
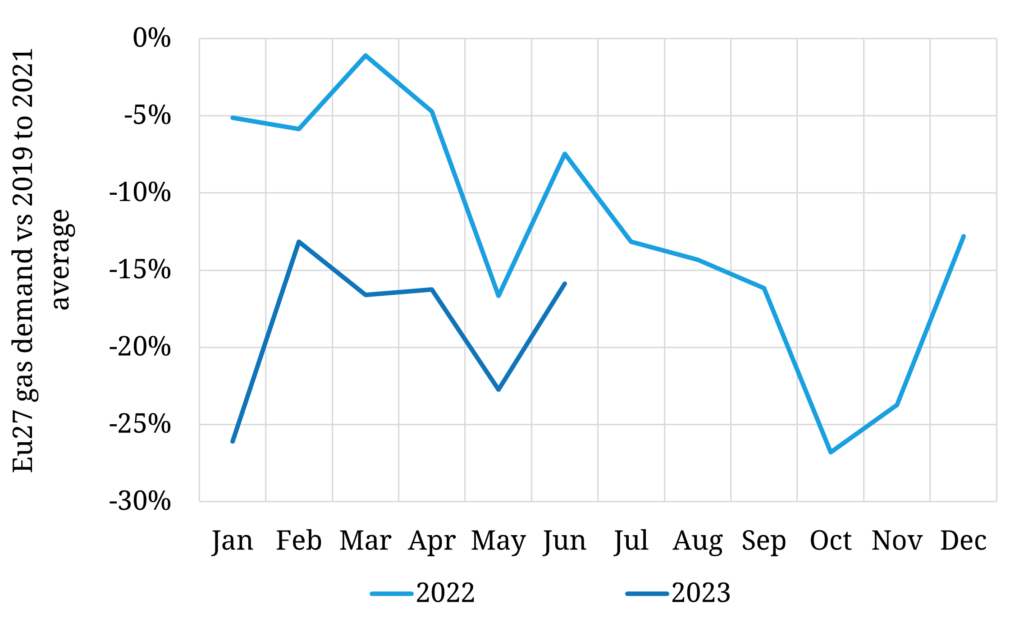
Source: Bruegel, Timera Energy
Relative demand moves are notoriously difficult to measure, but it appears that total gas demand is running at around 20% below pre-crisis levels. Demand reductions have occurred across all sectors (industrial, residential & power sector).
Very high prices in 2021-22 appear to have caused structural industrial demand destruction & offshoring. There have been some signs of recovery in industrial demand across Q2-3 2023 as prices have eased. Lag effects are in play in terms of demand response to price, so it is difficult to define the exact extent of permanent vs price sensitive demand loss.
Power sector gas demand in 2023 has been relatively weak, despite lower gas prices which have pushed deeper into the coal-gas switching range. Ongoing growth of RES output & healthier hydro balances this year are a factor here.
This rapid reduction in gas demand has played a key role in Europe weathering the gas crisis storm.
3. 2023 storage inventory overhang dampening prices
Europe storage injection has historically been an important driver of gas demand across summers. Chart 3 shows how Europe has entered this summer with record inventory levels, with a risk that storage may hit ‘tank tops’ by late summer.
Chart 3: EU underground gas storage levels

Source: Timera, GIE
Storage usually plays a key flex provision role in the European market. The unusually high level of inventories means that storage demand flex is much more constrained than normal.
Underground storage injection constraints are bringing alternative forms of storage into focus:
- Ukrainian storage which has more headroom but is typically more expensive & slower cycle (+ carries associated war risks)
- Floating LNG storage incentivised by the very steep Nov vs Sep curve contango; this has a knock-on impact of pushing up charter rates in the LNG market.
The knock-on effect of storage constraints is that European gas demand is less price responsive (more inelastic) than normal. This is a key contributing factor to lower summer price levels as the market needs to induce price response from other sources of flex (e.g. power sector & LNG cargo diversions). This price inelasticity is also contributing to a rise in price volatility this summer.
4. Asian LNG demand has failed to rebound so far in 2023
With Asian economies (most importantly China) coming out of strict lockdowns, market expectations were that Asian LNG demand would rebound in 2023.
The left hand panel of Chart 4 shows that this recovery hasn’t happened as expected. The right hand panel shows the knock-on implication of high European LNG import volumes.
Chart 4: Asian LNG import changes y-o-y (left panel); European LNG imports (right panel)
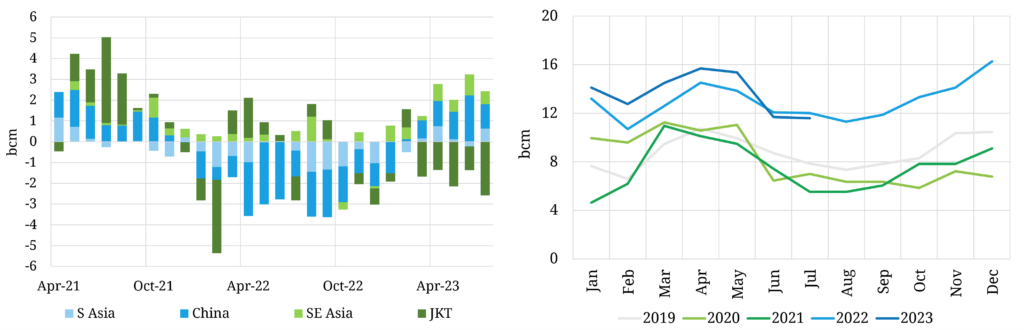
Source: Timera, LNG Unlimited; note European imports exclude Turkey
The left hand panel of the chart does show a gradual recovery in Asian LNG demand across China and other developing Asian markets (Sth & Sth East Asia). However this has been offset by weaker demand across Japan, Korea & Tawain (JKT), driven e.g. by the restart of Japanese nuclear reactors.
The right hand panel shows how weaker Asian demand has continued to drive a strong flow of LNG to Europe in 2023. However as this summer has progressed, weaker European demand & storage constraints have seen price signals adjusting to divert gas away from Europe.
5. Weaker European demand sees Asia return as premium market
A year after peak crisis, Europe and Asia are not in the fierce bidding competition for cargoes that the market anticipated. In fact the opposite is occurring – summer TTF prices have been falling to induce LNG cargo diversion to Asia.
This is reflected in the relative levels of the 3 key price signals that drive LNG cargo flows across the Atlantic & Pacific Basins:
- TTF has fallen to a discount to JKM
- The TTF premium to DES NW Europe LNG prices (a feature of the crisis) has narrowed substantially on the prompt, briefly flipping to a discount earlier in the month (see snapshot)
The impact on US FOB Gulf Coast netbacks is shown in Chart 5.
Chart 5: US FOB Gulf Coast Netback Forward Curve
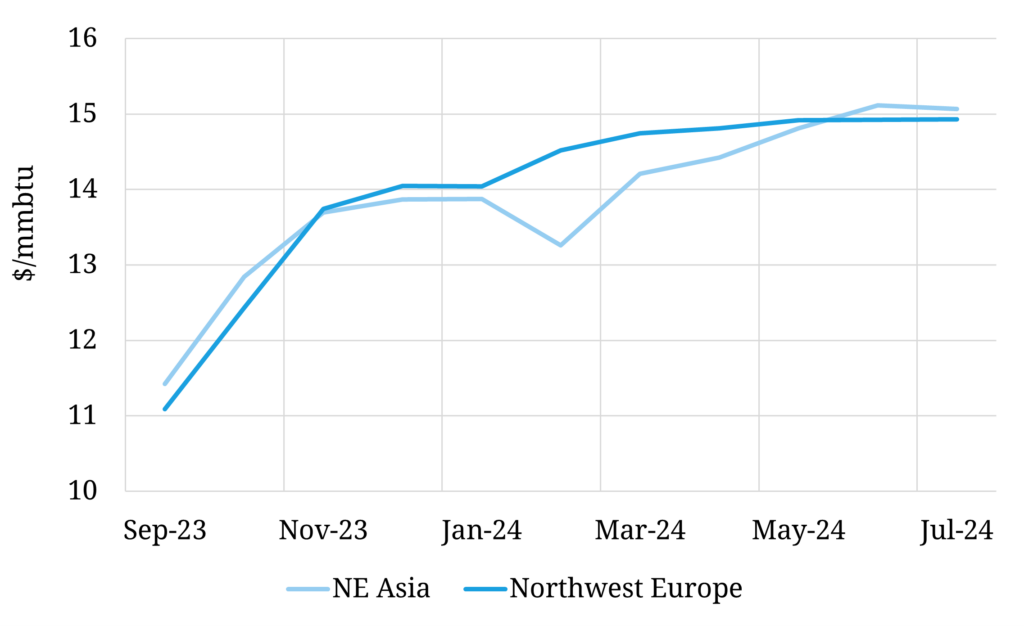
Source: Spark Commodities, Timera
Europe being a premium market for the large volumes of flexible US LNG has been feature of the Russian supply cut driven energy crisis through 2021-22. But in 2023 as the crisis has eased, North Asia has moved to offer more attractive netback pricing for US exporters across the next few months.
Volatility set to continue as market tightens into winter
We started by describing a forward curve in two parts. That is an important factor to remember. A lot of the current weakness in gas prices is driven by specific factors over the injection season of 2023 given very high storage inventories.
The TTF forward curve rises steeply into this winter and remains at elevated levels relative to historical averages across 2024-25, until the next wave of LNG supply starts to enter the market. Across this period the global gas market remains in a tight regime with asymmetric upside risk for prices, particularly in the case of a cold winter or major supply outages.
Across this 2024-25 horizon supply & demand also remain relatively inelastic as we set out in our recent webinar. And that supports a continuation of significant volatility in gas & power markets.