
Advertisement
Advertisement
Natural Gas Pullback: Key Levels Tested and Potential for Upside
By:
Key levels tested in natural gas retracement, highlighting the importance of the 55-Day EMA and buyer interest.

In this article:
Natural Gas Forecast Video for 17.07.23 by Bruce Powers
The pullback in natural gas continues as it drops below yesterday’s low before finding support at 2.492, the low of the day. That was almost an exact hit of the target for the 127.2% Fibonacci extension of the falling ABCD pattern. It completed at 2.495. That level is also the low of a price range that includes the 55-Day EMA at 2.52, and the completion of a 50% retracement at 2.507. An intraday bounce triggered off that low with natural gas set to close above the 34-Day line.
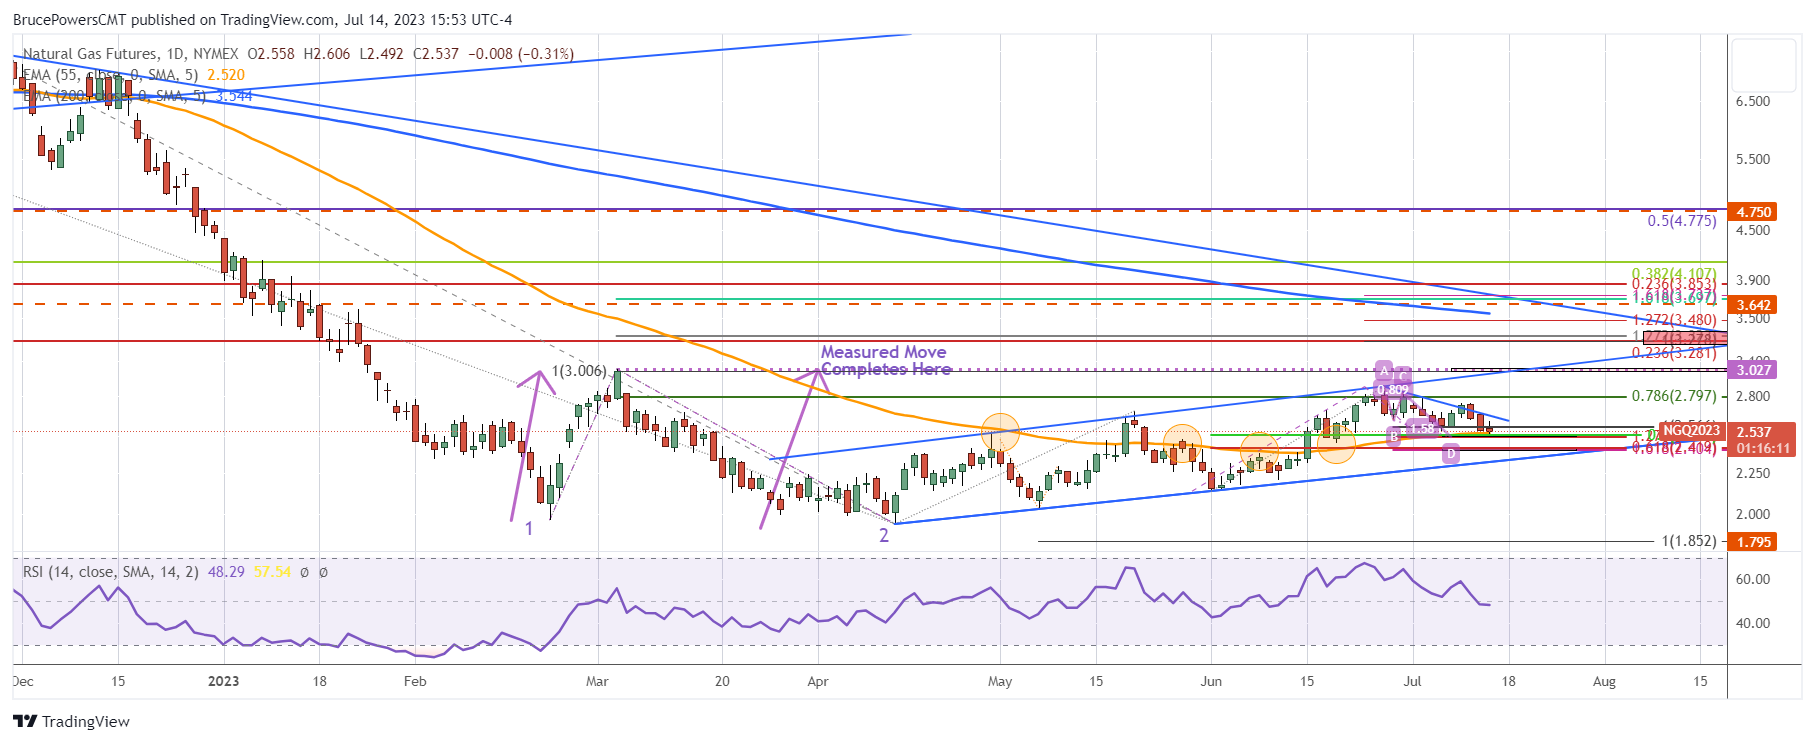
Today’s Low May be the Low for Now
It is possible that today’s low completes the retracement but if not, the next lower target zone is from 2.419 to 2.404. Of course, there is also the price area represented by the uptrend line. As noted previously, the 55-Day line looks to be important here. When price was below the 55-Day line most recently, it tested the line as resistance several times indicating the market is recognizing the line (circles). Natural gas broke out above the 55-Day line on June 15. Subsequently, it was tested as support a couple times and each time price was rejected to the upside.
Successful Test of 55-Day EMA Support
Today, the 55-Day EMA was again tested as support and it held, turning price back up. If natural gas is going to proceed to trend higher, today’s low would be a likely location to start seeing buyers step up again. Not only does the relationship of natural gas to the 55-Day line indicate improving underlying demand but there is also the relative strength seen compared to the previous two retracements. The prior retracement found support around the 61.8% retracement, while the one before that pulled back to the 78.6% Fibonacci area before finding support and turning higher. Each retracement is met with significant demand at a higher level relative to the retracement.
Current Retracement Shows Relative Strength
The current retracement shows relative strength when compared with the two prior corrections, as it is finding support at a higher level. Buyers stepping in at the 50% retracement indicates that they are more aggressive in their entries than seen previously.
For a look at all of today’s economic events, check out our economic calendar.
About the Author
Bruce Powersauthor
Bruce boasts over 20 years in financial markets, holding senior roles such as Head of Trading Strategy at Relentless 13 Capital and Corporate Advisor at Chronos Futures. A CMT® charter holder and MBA in Finance, he's a renowned analyst and media figure, appearing on 150+ TV business shows.
Did you find this article useful?
Latest news and analysis


Advertisement