Green
Hotter Than Ever: 2023 Sets New Global Temperature Records


Charting Record-Breaking Monthly Global Temperatures
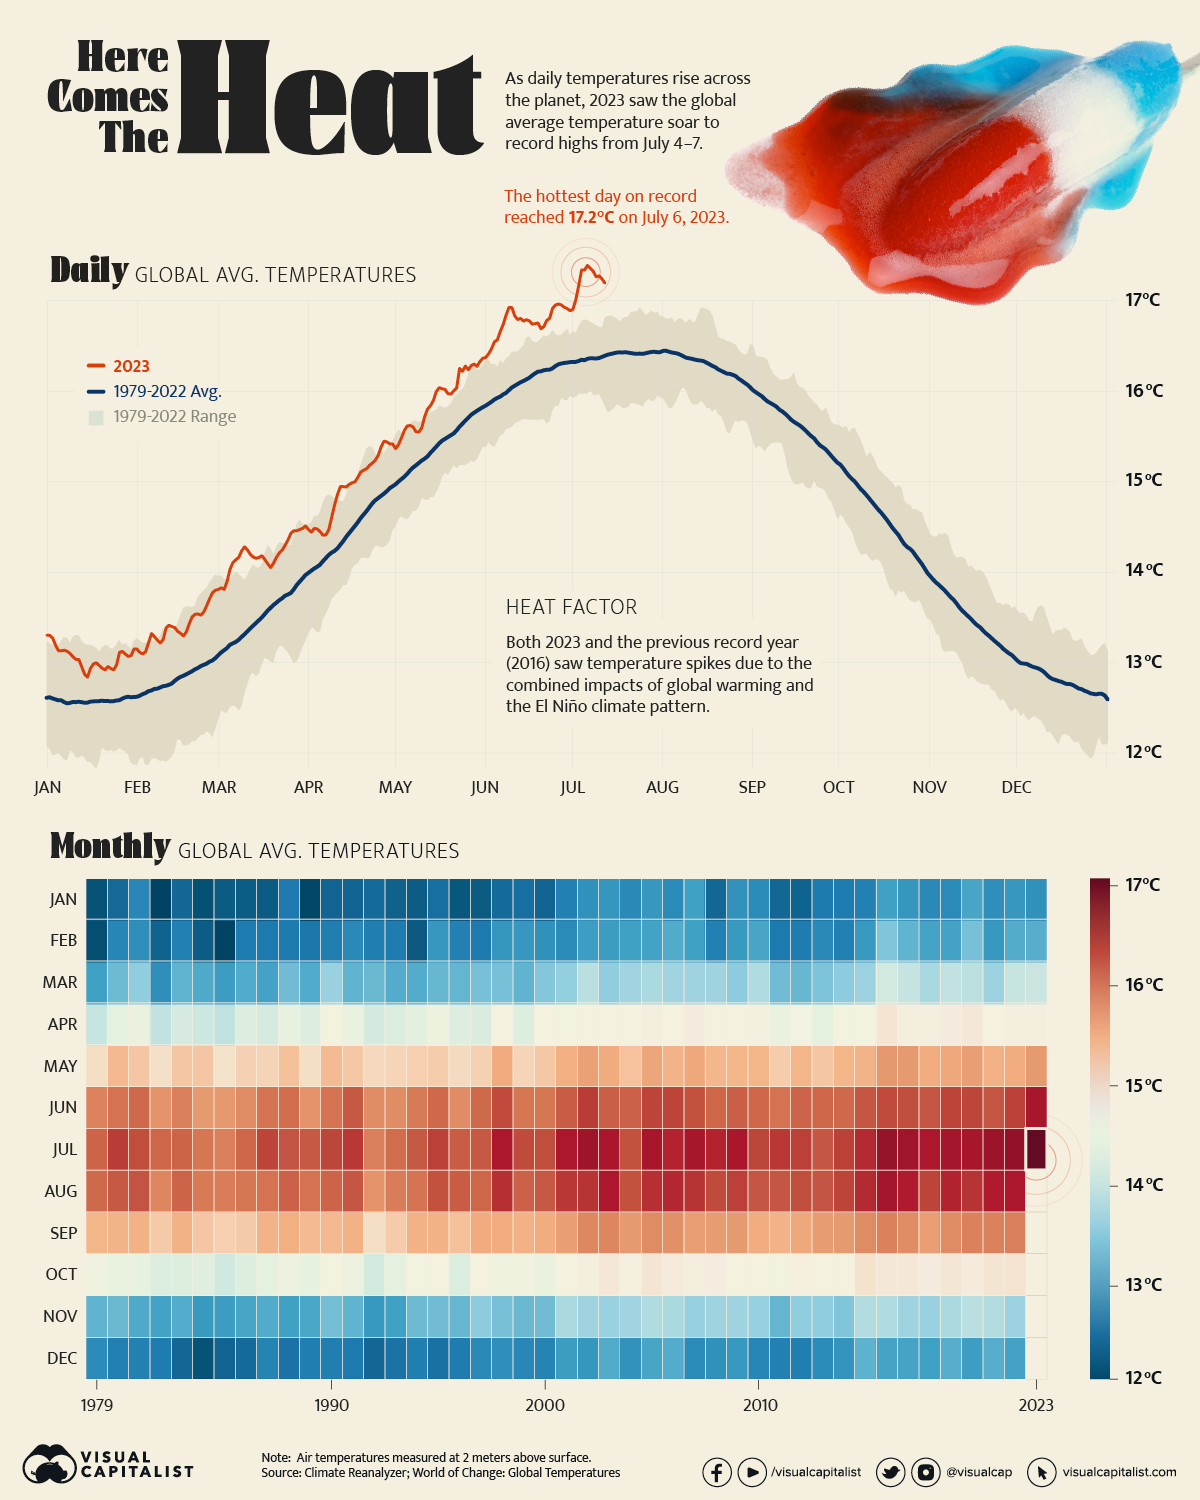
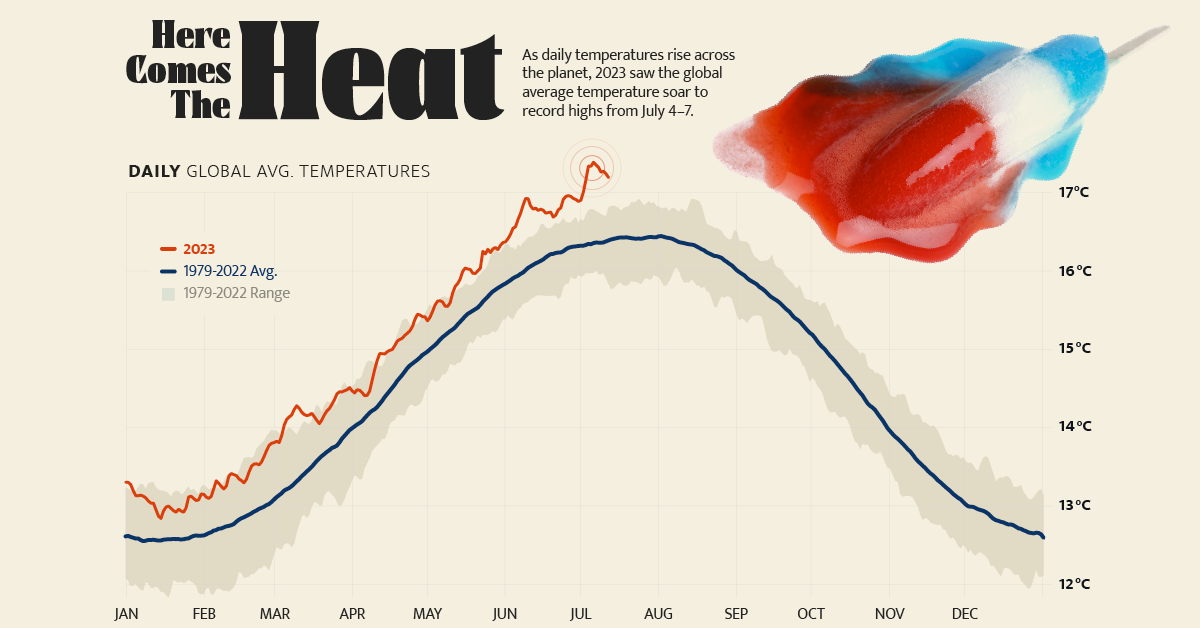
As local heat records are being broken across the planet, July 2023 also saw the global average temperature soar to an unprecedented 17.2°C (62.9°F).
In fact, according to the U.S. National Oceanic and Atmospheric Administration (NOAA), the four hottest days on record occurred from July 4 to July 7, 2023, breaking the previous record of 16.9°C (62.4°F) set in mid-August 2016.
The above graphic charts the average air temperature at 2 meters above the surface, since 1979, using data from Climate Reanalyzer.
What is Causing Record High Temperatures?
Temperature records were shattered in both 2023 and 2016 as a result of the dual impact of the El Niño climate phenomenon, which causes a significant rise in Pacific Ocean temperatures, and climate change.
Earth’s average global temperature has risen by at least 1.1°C (1.9°F) since 1880, and the pace has significantly increased in the last century alongside the burning of fossil fuels. The majority of the warming has occurred since 1975, with temperatures rising 0.15 to 0.20°C per decade.
According to the NOAA, six of the most recent months of July (typically the hottest month) were among the seven hottest months recorded by average global surface temperature:
| Rank | Hottest Months by Avg. Temp. | Celsius (°C) |
|---|---|---|
| 1 | July 2023* | 17.07°C |
| 2 | July 2022 | 16.75°C |
| 3 | July 2016 | 16.72°C |
| 4 | July 2021 | 16.70°C |
| 5 | July 2002 | 16.67°C |
| 6 | July 2017 | 16.66°C |
| 7 | July 2019 | 16.64°C |
*As of July 12, 2023
Although these figures show marginal increases in the world’s average temperatures, the effects are far more noticeable on a local scale.
In July 2023, temperatures in Texas surpassed those of Northern Africa, as they reached 43.3°C (110°F). Across the Pacific, cities around China used bomb shelters as cooling centers during a 10-day streak of days above 35°C (95°F).
“We are in uncharted territory and we can expect more records to fall as El Niño develops further and these impacts will extend into 2024,”
– Christopher Hewitt, World Meteorological Organization
How to Mitigate Climate Change?
Transitioning to renewable energy sources, reducing or capturing greenhouse gas emissions, and implementing sustainable practices are considered key steps towards slowing climate change.
According to NASA, the future will also require adaptation, reducing our risks from the harmful effects of climate change (such as sea-level rise, more intense extreme weather events, or food insecurity) as well as taking advantage of any potential positive opportunities associated with climate change (such as longer growing seasons and higher yields in some regions).


Environment
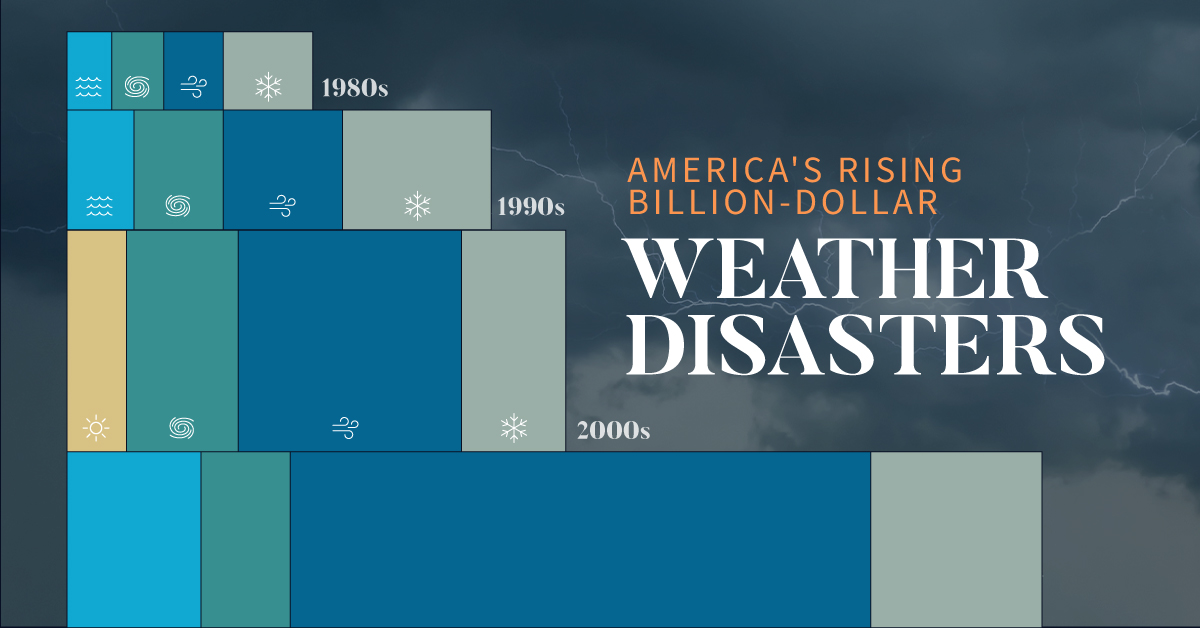
The Rise in America’s Billion-Dollar Extreme Weather Disasters
From tropical cyclones to severe storms, the number of extreme weather disasters with losses exceeding $1 billion has climbed over time.
The Rise in U.S. Billion-Dollar Extreme Weather Disasters
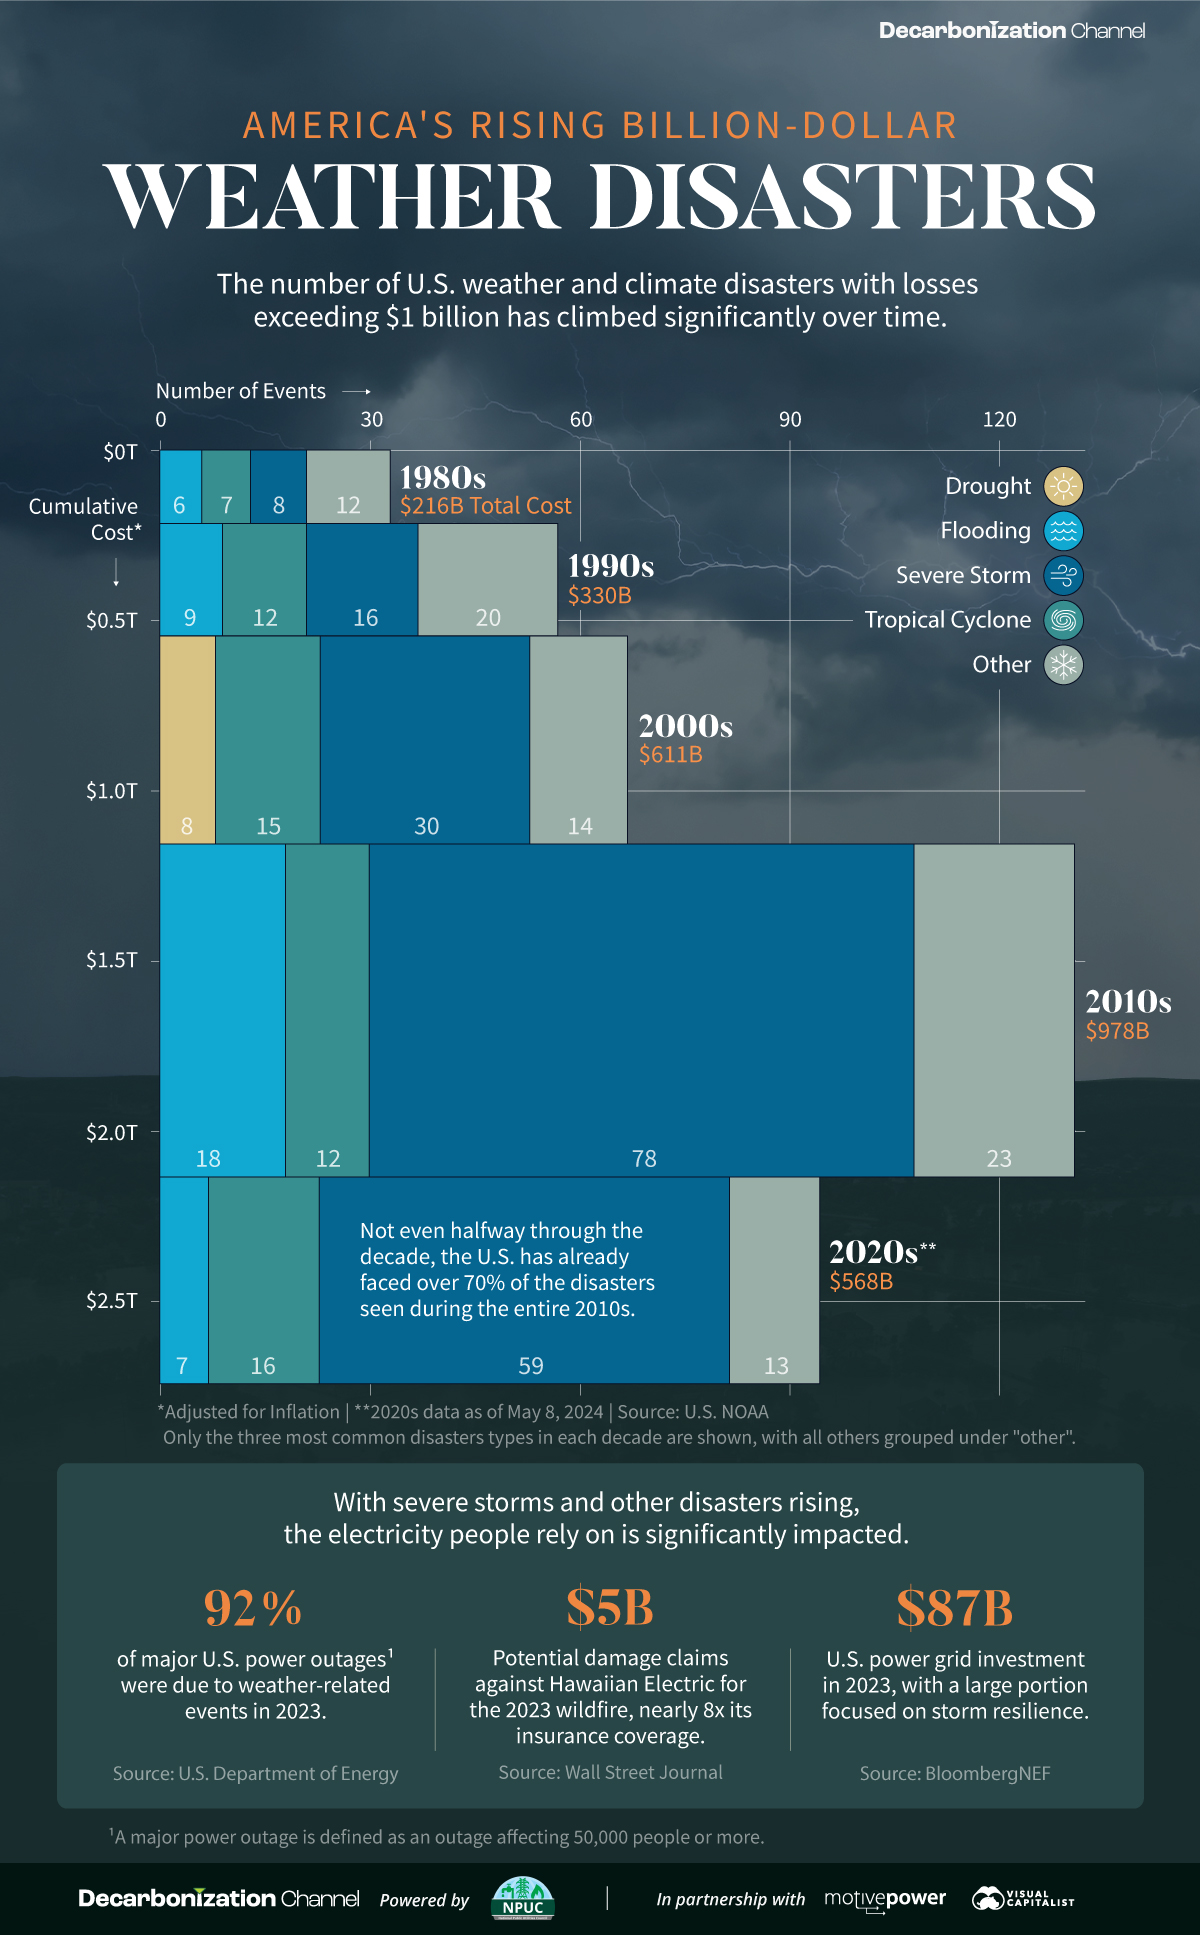
Since 1980, there have been 383 extreme weather or climate disasters where the damages reached at least $1 billion. In total, these disasters have cost more than $2.7 trillion.
Created in partnership with the National Public Utilities Council, this chart shows how these disasters have been increasing with each passing decade.
A Growing Concern
The U.S. National Oceanic and Atmospheric Administration (NOAA) tracks each disaster and estimates the cost based on factors like physical damages and time losses such as business interruption. They adjust all costs by the Consumer Price Index to account for inflation.
| Decade | Total No. of Events | Total Inflation-Adjusted Cost |
|---|---|---|
| 1980s | 33 | $216B |
| 1990s | 57 | $330B |
| 2000s | 67 | $611B |
| 2010s | 131 | $978B |
| 2020s* | 95 | $568B |
* Data is as of May 8, 2024.
Both the number and cost of extreme weather disasters has grown over time. In fact, not even halfway through the 2020s the number of disasters is over 70% of those seen during the entire 2010s.
Severe storms have been the most common, accounting for half of all billion-dollar disasters since 1980. In terms of costs, tropical cyclones have caused the lion’s share—more than 50% of the total. Hurricane Katrina, which made landfall in 2005, remains the most expensive single event with $199 billion in inflation-adjusted costs.
Electricity and Extreme Weather Disasters
With severe storms and other disasters rising, the electricity people rely on is significantly impacted. For instance, droughts have been associated with a decline in hydropower, which is an important source of U.S. renewable electricity generation.
Disasters can also lead to significant costs for utility companies. Hawaii Electric faces $5 billion in potential damages claims for the 2023 wildfire, which is nearly eight times its insurance coverage. Lawsuits accuse the company of negligence in maintaining its infrastructure, such as failing to strengthen power poles to withstand high winds.
Given that the utilities industry is facing the highest risk from extreme weather and climate disasters, some companies have begun to prepare for such events. This means taking steps like burying power lines, increasing insurance coverage, and upgrading infrastructure.
Learn how the National Public Utilities Council is working toward the future of sustainable electricity.

-

 Environment2 months ago
Ranked: Top Countries by Total Forest Loss Since 2001
The country with the most forest loss since 2001 lost as much forest cover as the next four countries combined.
-

 Environment3 months ago
Charted: Share of World Forests by Country
We visualize which countries have the biggest share of world forests by area—and while country size plays a factor, so too, does the environment.
-

 Environment4 months ago
Which Countries Have the Largest Forests?
Together, the top five countries with the largest forests account for more than half of the world’s entire forest cover.
-

 Environment5 months ago
Visualized: What Lives in Your Gut Microbiome?
The human gut microbiome contains a world of microbes. We look at the the bacteria that deeply affect our health and well-being.
-

 Environment6 months ago
Mapped: Global Temperature Rise by Country (2022-2100P)
In this set of three maps, we show the global temperature rise on a national level for 2022, 2050, and 2100 based on an analysis by…
-

 Environment6 months ago
Ranked: Per Capita Carbon Emissions by Country
Which countries rank the highest in per capita carbon emissions, and how do they impact the world’s total carbon emissions?

-
 Maps1 week ago
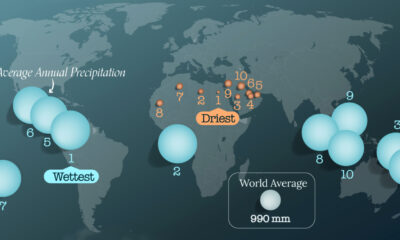
Mapped: The World’s Wettest and Driest Countries
-

 Public Opinion2 weeks ago
Charted: How Democrats and Republicans View Government Agencies
-

 Globalization2 weeks ago
Mapped: The Top Exports in Asian Countries
-

 Finance2 weeks ago
Ranked: The World’s 50 Largest Private Equity Firms
-

 United States2 weeks ago
Mapped: The 10 U.S. States With the Lowest Real GDP Growth
-

 China2 weeks ago
Comparing New and Current U.S. Tariffs on Chinese Imports
-

 Politics2 weeks ago
Which Countries Have the Most Economic Influence in Southeast Asia?
-

 population2 weeks ago
The Top 25 Nationalities of U.S. Immigrants