
Advertisement
Advertisement
Natural Gas Analysis: Strengthening Trend Signals Potential Upside Breakout Eventually
By:
The analysis of natural gas reveals a strengthening trend represented by the 34-Day line, signaling potential upside and growing demand.

In this article:
Natural Gas Forecast Video for 30.05.23 by Bruce Powers
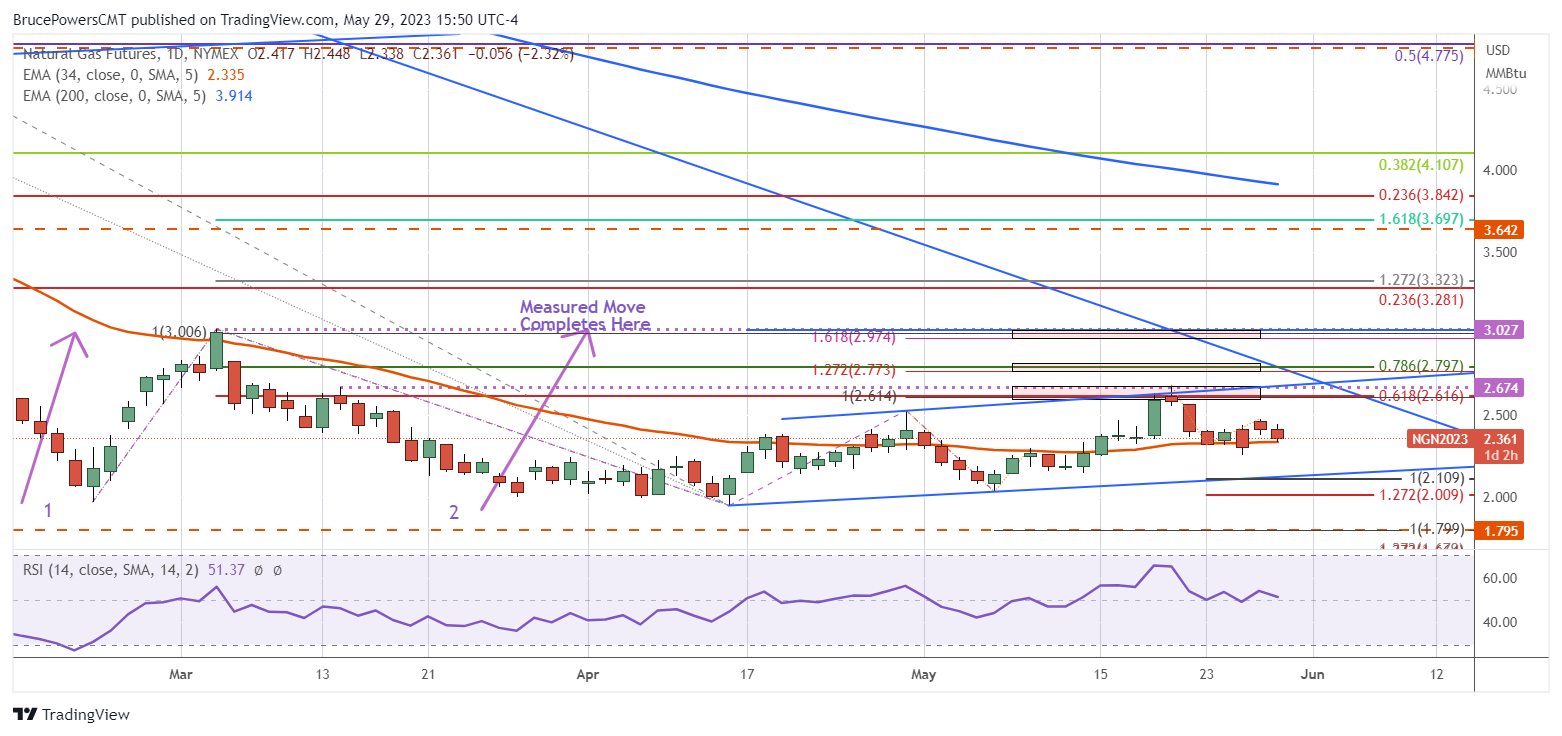
We can start our analysis of natural gas by observing the 34-Day exponential moving average (EMA) since price bottomed in February at 1.97. At the low the difference between the price of natural gas and the 34-Day line was at a maximum. Price eventually swung back in the other direction, which was up, before touching the line in early-March for the first time since moving below it in mid-December. Natural gas was strong enough at that point to close above it for one day before selling took hold again and pushed prices back down.
Trend Indicator Tested as both Support and Resistance
In April, a test of the 34-Day line as resistance continued. There were six days that traded above the line and at least three days that closed above the line on a daily basis. Most recently, natural gas moved back above the 34-Day EMA on May 15, following a four-day test of the line as resistance. Since then, it has largely marked support, including today as support of the line was tested again. The low of the day is at 2.34 and the 34-Day line is at 2.34 as well.
Watching 34-Day EMA Provides Clues
What the above analysis indicates is that the trend represented by the 34-Day line is slowly starting to strengthen. The market has recognized it on multiple days as either support or resistance. It deserves to be watched going forward for further signs of strength or weakness. So far, it continues to maintain a flat slope as prices have been consolidating around the bottom of the trend. A move higher from the 34-Day line is bullish, while further trade below it is neutral or short-term bearish.
Signs of Strength Above Today’s High
On the upside, a move above today’s high of 2.45 is a sign of strength, which is further confirmed by a move above the two-day high of 2.48. A daily close above that high has natural gas next testing and likely exceeding the most recent swing high at 2.69. Once natural gas closes above 2.69 on a daily basis, further upside potential kicks in as that would be a new sign of growing demand.
For a look at all of today’s economic events, check out our economic calendar.
About the Author
Bruce Powersauthor
Bruce boasts over 20 years in financial markets, holding senior roles such as Head of Trading Strategy at Relentless 13 Capital and Corporate Advisor at Chronos Futures. A CMT® charter holder and MBA in Finance, he's a renowned analyst and media figure, appearing on 150+ TV business shows.
Did you find this article useful?
Latest news and analysis


Advertisement