
Advertisement
Advertisement
Analyzing Natural Gas: Breakout Potential and Price Targets
By:
Natural gas will show strength if it breaks above 50-Day EMA resistance, indicating potential for a bullish rally towards key price targets.

In this article:
Natural Gas Forecast Video for 25.05.23 by Bruce Powers
Before its breakout above the 50-Day EMA resistance, natural gas tested it as support for three days before it broke through. The breakout day was clear and decisive, with a wide-ranging green candle and the day ending near the high of the day’s range. There were two days where natural gas closed above the 50-Day line. It hadn’t closed above the line since mid-December. This is a sign that natural gas is slowly starting to strengthen. Note how the initial test of the line as resistance at the end of April was quickly met by resistance and the day ended below the line.
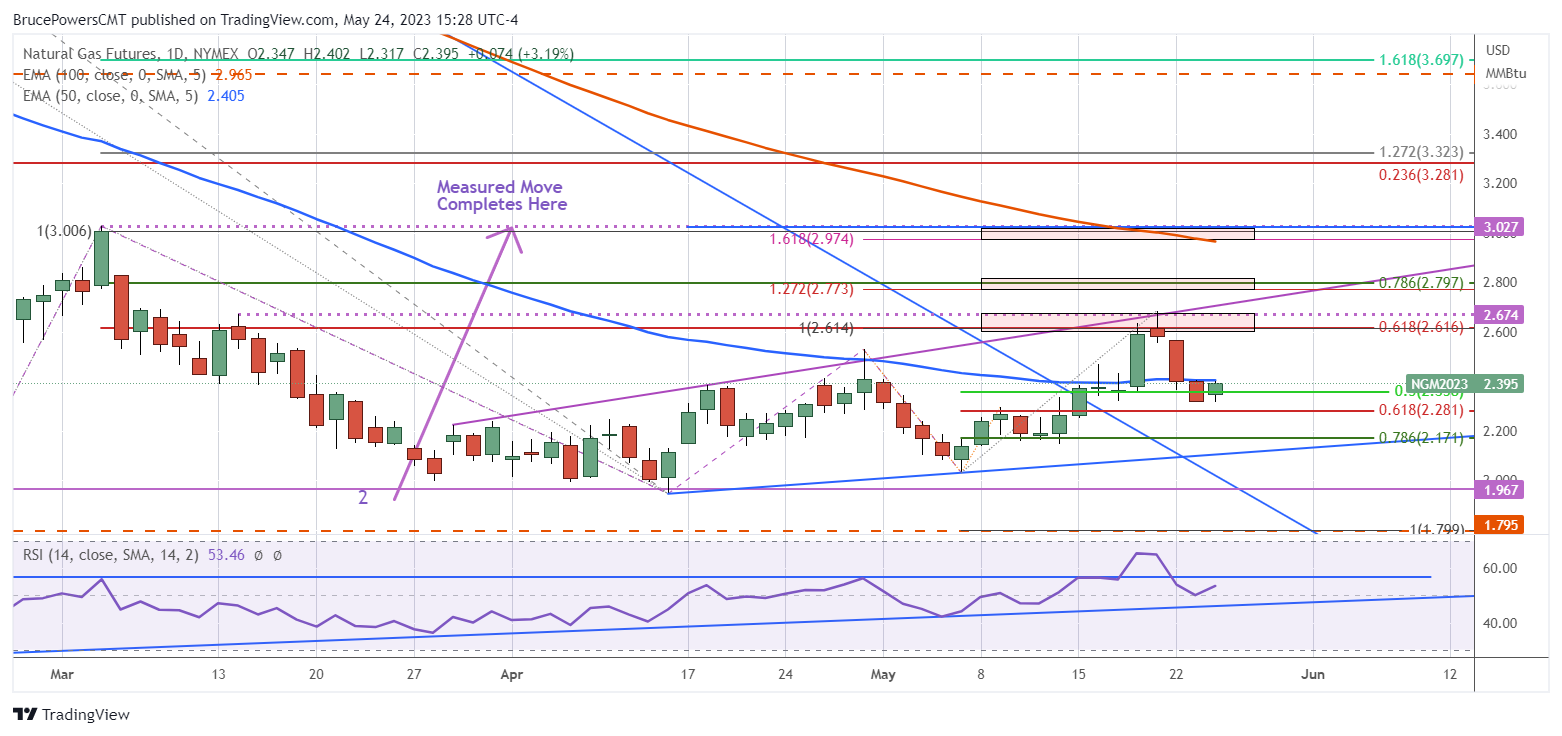
Low Activity Day May Setup Next Move
Today, Wednesday, natural gas has traded inside day and is likely to end the day that way. Resistance is at the high of the day at 2.402, along with the two-day high of 2.407, while the 50-Day EMA is at 2.405. Therefore, a decisive rally above 2.407 will trigger a breakout of three levels. The most important being the moving average as it helps define the parameters of the trend. Once a trend begins it tends to continue for some period. Another daily close above the 50-Day line is an alert that the trend is starting to improve. Once it gets going it can really take off.
Prior Rally Performance Can Happen Again
The performance of the past three rallies off trend lows, starting with the most recent, was 32.2%, 30.0%, and 53.9%, respectively. It is reasonable to project that the next rally may also advance at a minimum of 30.0%. The first target zone (red highlight) for natural gas was hit last week. Once complete at a high of 2.69, price was quickly rejected to the downside.
100-Day EMA Eventual Target
The next higher target zone is around 2.77 to 2.83, consisting of a daily high, the 78.6% Fibonacci retracement, and the completion of an ABCD pattern with a 127.2% Fibonacci extension applied to the CD leg. If the 2.83 is exceeded, natural gas would next be heading towards the 100-Day EMA, which is now at 2.97. There are also additional price levels near there that are marked on the chart.
For a look at all of today’s economic events, check out our economic calendar.
About the Author
Bruce Powersauthor
Bruce boasts over 20 years in financial markets, holding senior roles such as Head of Trading Strategy at Relentless 13 Capital and Corporate Advisor at Chronos Futures. A CMT® charter holder and MBA in Finance, he's a renowned analyst and media figure, appearing on 150+ TV business shows.
Did you find this article useful?
Latest news and analysis


Advertisement