
Advertisement
Advertisement
Natural Gas Triggers Bearish Trend Continuation
By:
Further weakness seen in natural gas as it heads towards monthly support.

In this article:
Natural Gas Forecast Video for 26.01.23 by Bruce Powers
Natural gas fell to a new trend low on Wednesday and is fast approaching its next potential support zone. As of the day’s 3.05 low, it was down as much as 59.8% off the November 23, 2022, at the time of this writing. That decline occurred quickly, in only 41 trading days. It continues its descent below the 12-Day EMA, which was tested as resistance specifically at Tuesday’s 3.59 high before price was reversed to the downside.
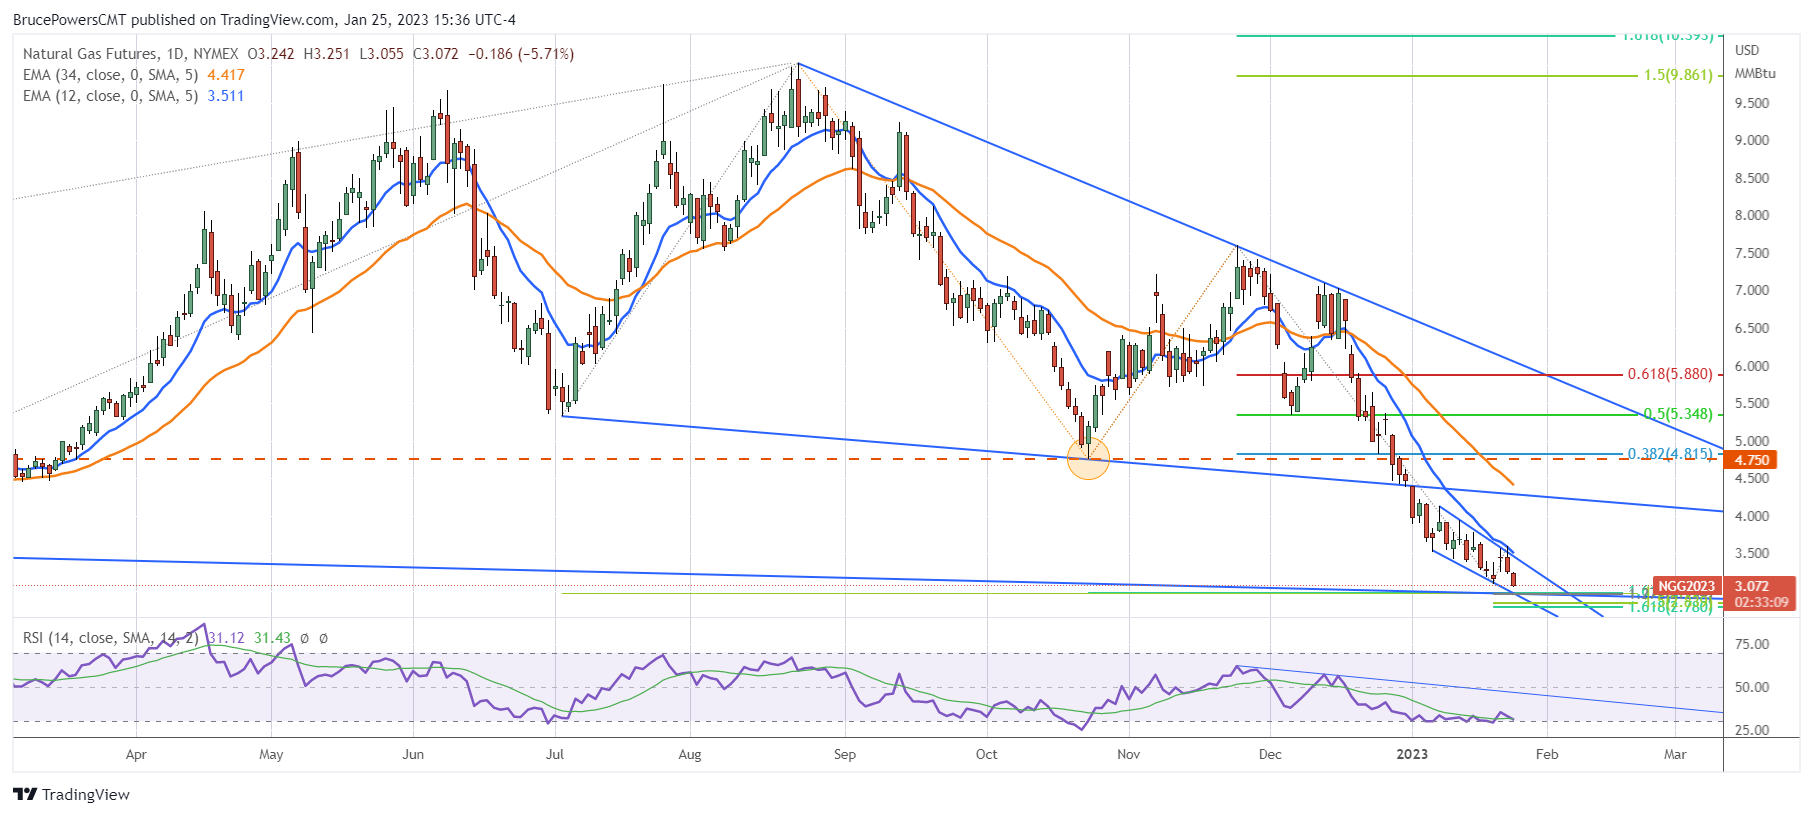
Declining in Within Small Trend Channel
For the past 11 days or so natural gas has been falling within a small parallel trend channel. Tuesday’s test of the 12-Day line attempted a breakout of the channel as price broke above the top line before being rejected. Since price clearly noticed the 12-Day line it can be watched as a near-term trend indicator. A decisive breakout above it will be one signal for a bullish reversal. In fact, Tuesday’s 3.59 high can be used along with the 12-Day EMA. The line is now at 3.51.
Monthly Support Might be Reached Soon
If natural gas keeps falling monthly support is at 3.01, the low from June 2021. Plus, there is a Fibonacci confluence zone from 2.99 to 2.95, consisting of several Fibonacci support levels. Together, these levels create a support zone from 3.01 to 2.95. Lower still is the lower downward sloping trendline connecting two swing lows around 2.90.
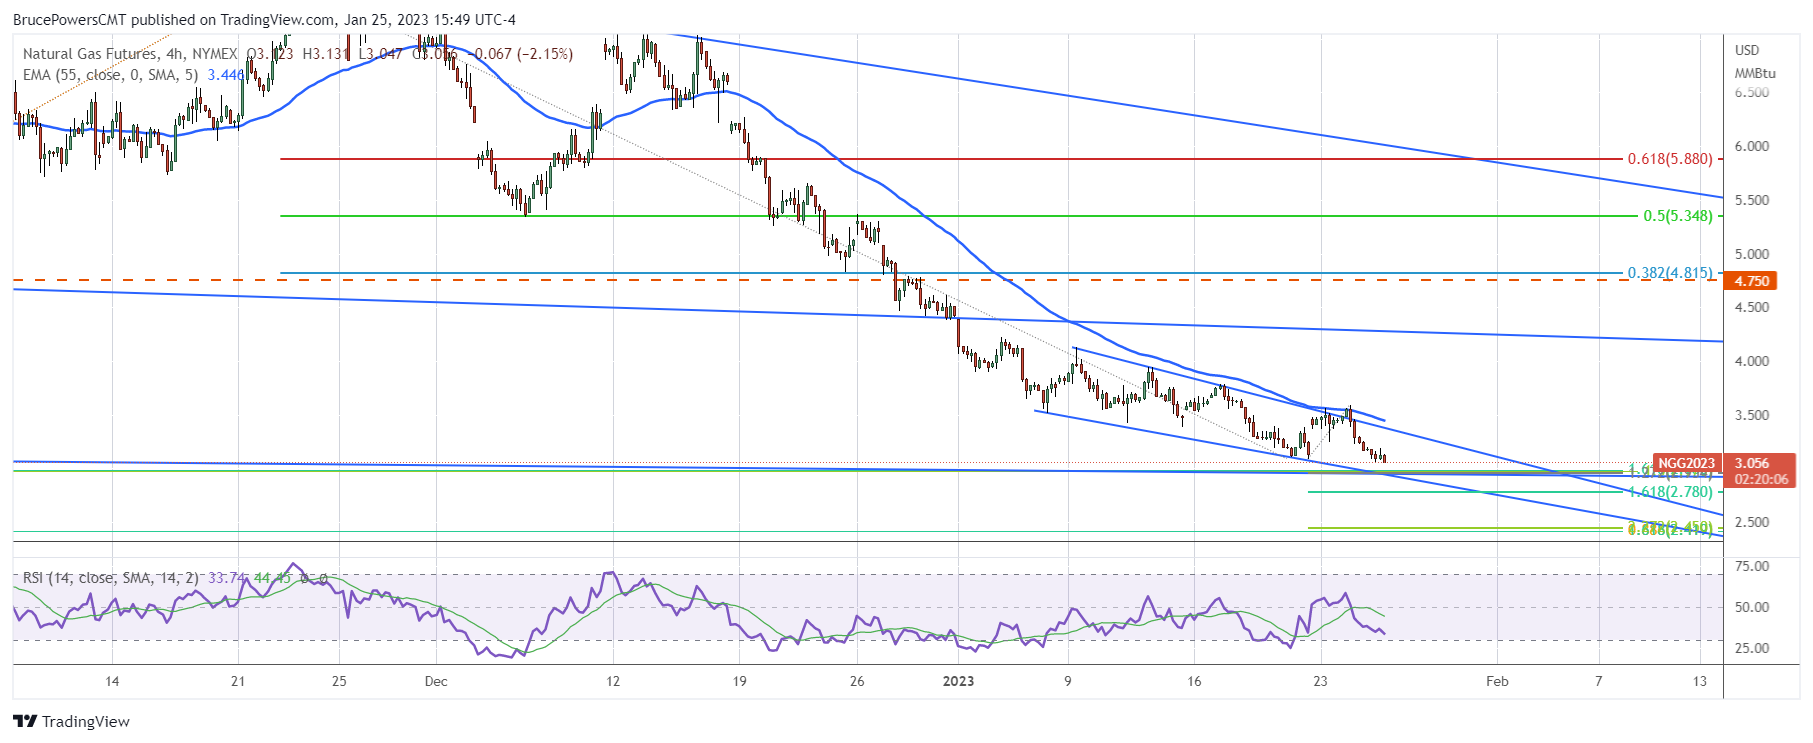
Inside the Day on a 4-Hour Chart
The 4-hour chart provides further details as to recent price action. Here, Fibonacci extensions of the must recent bounce of 127.2% and 161.8% are included. We measure a Fibonacci retracement from that low to Tuesday’s high and look at a greater than 100% retracements. A full 100% retracement would complete at the 3.09 swing low. The 127% fits the support zone noted above and the 161.8% extension is hit at 2.78.
Certainly, natural gas can keep declining but when the bullish turn up comes it can happen quickly. An initial minimum target on the upside is around 4.75, the swing low support, now resistance, from October 2022.
For a look at all of today’s economic events, check out our economic calendar.
About the Author
Bruce Powersauthor
Bruce boasts over 20 years in financial markets, holding senior roles such as Head of Trading Strategy at Relentless 13 Capital and Corporate Advisor at Chronos Futures. A CMT® charter holder and MBA in Finance, he's a renowned analyst and media figure, appearing on 150+ TV business shows.
Did you find this article useful?
Latest news and analysis


Advertisement