
Advertisement
Advertisement
Natural Gas Hit with False Breakout as Strength Falters
By:
Bulls attempt a breakout to the upside but are quickly hit with aggressive selling.

In this article:
Natural Gas Forecast Video for 25.01.23 by Bruce Powers
It seems like natural gas is not yet ready to reverse to the upside. It tried earlier in the day but so far has failed to hold the breakout and has fallen back into its previous price range.
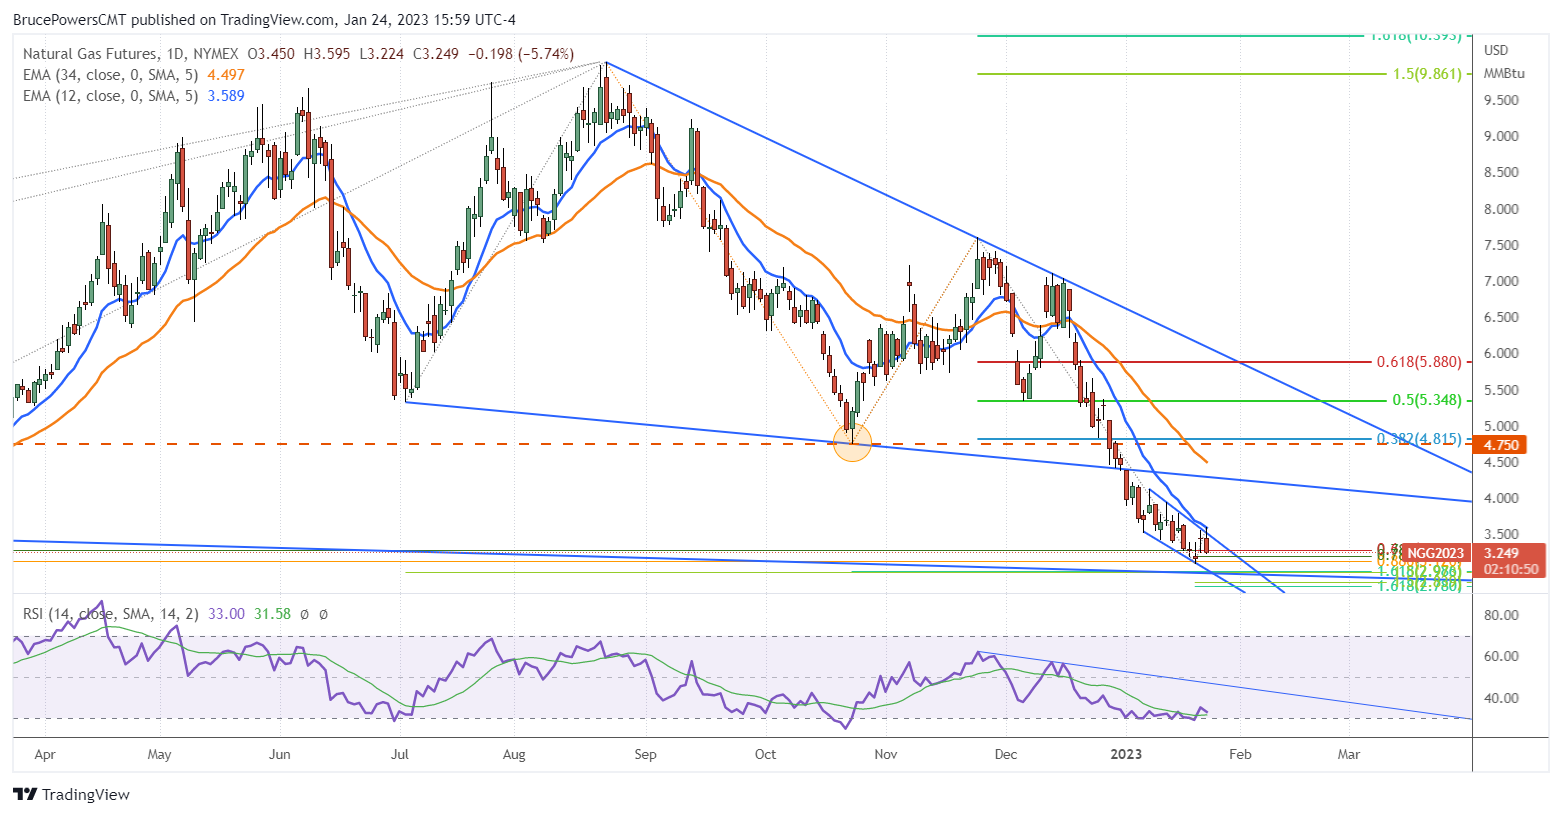
Natural gas broke out above Monday’s 3.56 high early in the day to eventually rally into resistance at the 12-Day EMA at 3.59. That’s the high for the day so far. Subsequently, it turned down to eventually fall below Monday’s low thereby generating an outside day. So far, natural gas is also trading inside week. The early-morning rally also provided a false breakout of the declining parallel channel as price got above the top line of the channel before reversing lower.
Trend Lows Sitting on Support Zone
Natural gas is sitting on a possible support zone from the confluence of multiple Fibonacci price levels. So far support has stopped the descent but is not clear yet that it is going to hold and turn higher from here, although it could.
Natural gas has been trending down for 40 days (November 23 high) and most recently traded within a declining parallel trend channel. The 14-Day RSI is starting to come off the bottom but needs further bullish confirmation. If natural gas falls below 3.09, the current trend low, it next heads towards the 2.98 support area.
Bullish Signal
Based on the daily chart, natural gas will not have a clear bullish signal until a decisive rally above the 12-Day EMA at 3.59 and the five-day high of 3.64. This range can be watched as a price zone. A daily close above 3.64 will then further confirm the switch to bullish sentiment.
Reversal Higher Still Possible
There is quite a bit of upside potential once natural gas reverses to the upside if it is to do so. Following the November 23, 2022 peak, it fell as much as 59.3% and it took only 38 days to do so. This is a relatively rapid decline which could be followed by a sharp countertrend rally, up into various resistance levels. The first obvious target is the 38.2% Fibonacci retracement at 4.75 to 4.81. That range includes a prior swing low support level from late-October at 4.85, now possible resistance. It is roughly 34% above Tuesday’s high.
For a look at all of today’s economic events, check out our economic calendar.
About the Author
Bruce Powersauthor
Bruce boasts over 20 years in financial markets, holding senior roles such as Head of Trading Strategy at Relentless 13 Capital and Corporate Advisor at Chronos Futures. A CMT® charter holder and MBA in Finance, he's a renowned analyst and media figure, appearing on 150+ TV business shows.
Did you find this article useful?
Latest news and analysis


Advertisement