- WTI takes offers to refresh intraday low, prints the biggest daily losses in a week.
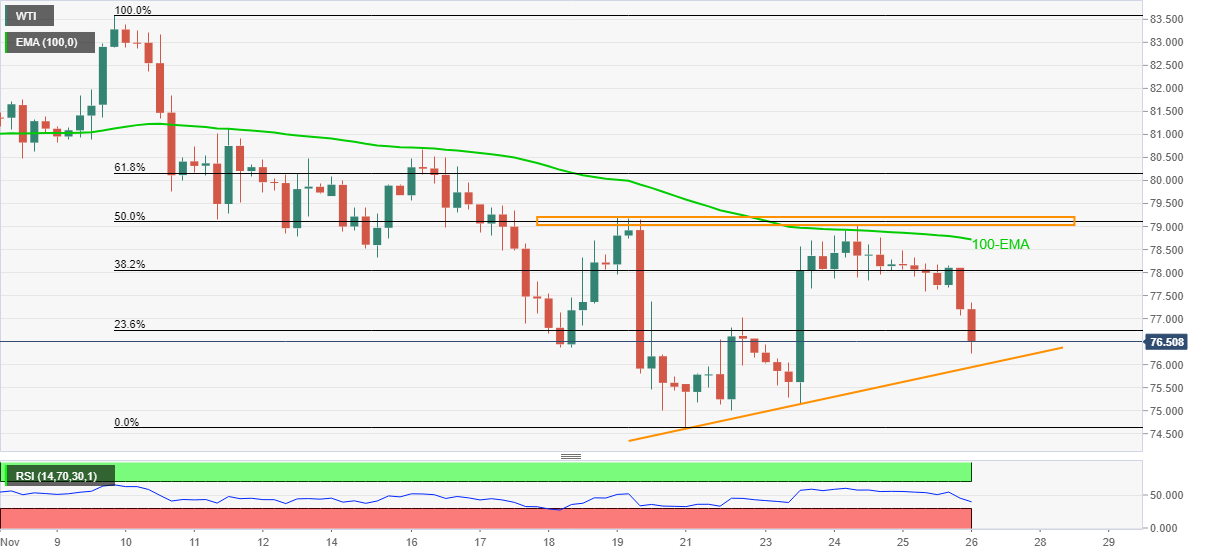
- Descending RSI line, failures to cross 100-EMA favor sellers.
- Break of $76.00 will confirm bearish chart pattern signaling further declines to $71.50.
WTI stands on slippery ground, down over 2.0% near $76.40 during early Friday. In doing so, the black gold drops the most in a week amid the three-day downtrend.
A one-week-old ascending triangle bearish formation portrays the commodity’s latest weakness, coupled with a downward sloping RSI line.
The quote currently drops towards the pattern’s support line near $76.00, a break of which confirms the theoretical fall towards the $71.50 level.
However, the recent low near $74.60 and July’s top of $74.20, followed by September’s high near $73.10, will act as intermediate halts during the south-run.
Meanwhile, the corrective pullback will eye for the 100-EMA level of $78.70 before directing the quote towards the stated triangle’s resistance surrounding the $79.00-20 area.
In a case where the WTI crude oil rises past $79.20, bulls will aim for the November 11 top near $81.10 before challenging the November 09 peak of $83.60.
Overall, WTI prices are likely to remain weak but a clear break of the stated triangle becomes necessary for the bears to keep reins.
WTI: Four-hour chart
Trend: Further weakness expected
Information on these pages contains forward-looking statements that involve risks and uncertainties. Markets and instruments profiled on this page are for informational purposes only and should not in any way come across as a recommendation to buy or sell in these assets. You should do your own thorough research before making any investment decisions. FXStreet does not in any way guarantee that this information is free from mistakes, errors, or material misstatements. It also does not guarantee that this information is of a timely nature. Investing in Open Markets involves a great deal of risk, including the loss of all or a portion of your investment, as well as emotional distress. All risks, losses and costs associated with investing, including total loss of principal, are your responsibility. The views and opinions expressed in this article are those of the authors and do not necessarily reflect the official policy or position of FXStreet nor its advertisers. The author will not be held responsible for information that is found at the end of links posted on this page.
If not otherwise explicitly mentioned in the body of the article, at the time of writing, the author has no position in any stock mentioned in this article and no business relationship with any company mentioned. The author has not received compensation for writing this article, other than from FXStreet.
FXStreet and the author do not provide personalized recommendations. The author makes no representations as to the accuracy, completeness, or suitability of this information. FXStreet and the author will not be liable for any errors, omissions or any losses, injuries or damages arising from this information and its display or use. Errors and omissions excepted.
The author and FXStreet are not registered investment advisors and nothing in this article is intended to be investment advice.
Recommended content
Editors’ Picks
EUR/USD retreats toward 1.0650 after PMI-inspired rebound

EUR/USD loses traction and retreats to the 1.0650 area after rising toward 1.0700 with the immediate reaction to the upbeat PMI reports from the Eurozone and Germany. The cautious market stance helps the USD hold its ground ahead of US PMI data.
GBP/USD fluctuates near 1.2350 after UK PMIs

GBP/USD clings to small daily gains near 1.2350 in the European session on Tuesday. The data from the UK showed that the private sector continued to grow at an accelerating pace in April, helping Pound Sterling stay resilient against its rivals.
Gold flirts with $2,300 amid receding safe-haven demand

Gold (XAU/USD) remains under heavy selling pressure for the second straight day on Tuesday and languishes near its lowest level in over two weeks, around the $2,300 mark in the European session. Eyes on US PMI data.
Here’s why Ondo price hit new ATH amid bearish market outlook Premium

Ondo price shows no signs of slowing down after setting up an all-time high (ATH) at $1.05 on March 31. This development is likely to be followed by a correction and ATH but not necessarily in that order.
US S&P Global PMIs Preview: Economic expansion set to keep momentum in April

S&P Global Manufacturing PMI and Services PMI are both expected to come in at 52 in April’s flash estimate, highlighting an ongoing expansion in the private sector’s economic activity.