Energy
What’s Made from a Barrel of Oil?
![]() Subscribe to the Elements free mailing list for more like this
Subscribe to the Elements free mailing list for more like this


What Products Are Made from a Barrel of Oil?
This was originally posted on Elements. Sign up to the free mailing list to get beautiful visualizations on natural resource megatrends in your email every week.
From the gasoline in our cars to the plastic in countless everyday items, crude oil is an essential raw material that shows up everywhere in our lives.
With around 18 million barrels of crude oil consumed every day just in America, this commodity powers transport, utilities, and is a vital ingredient in many of the things we use on a daily basis.
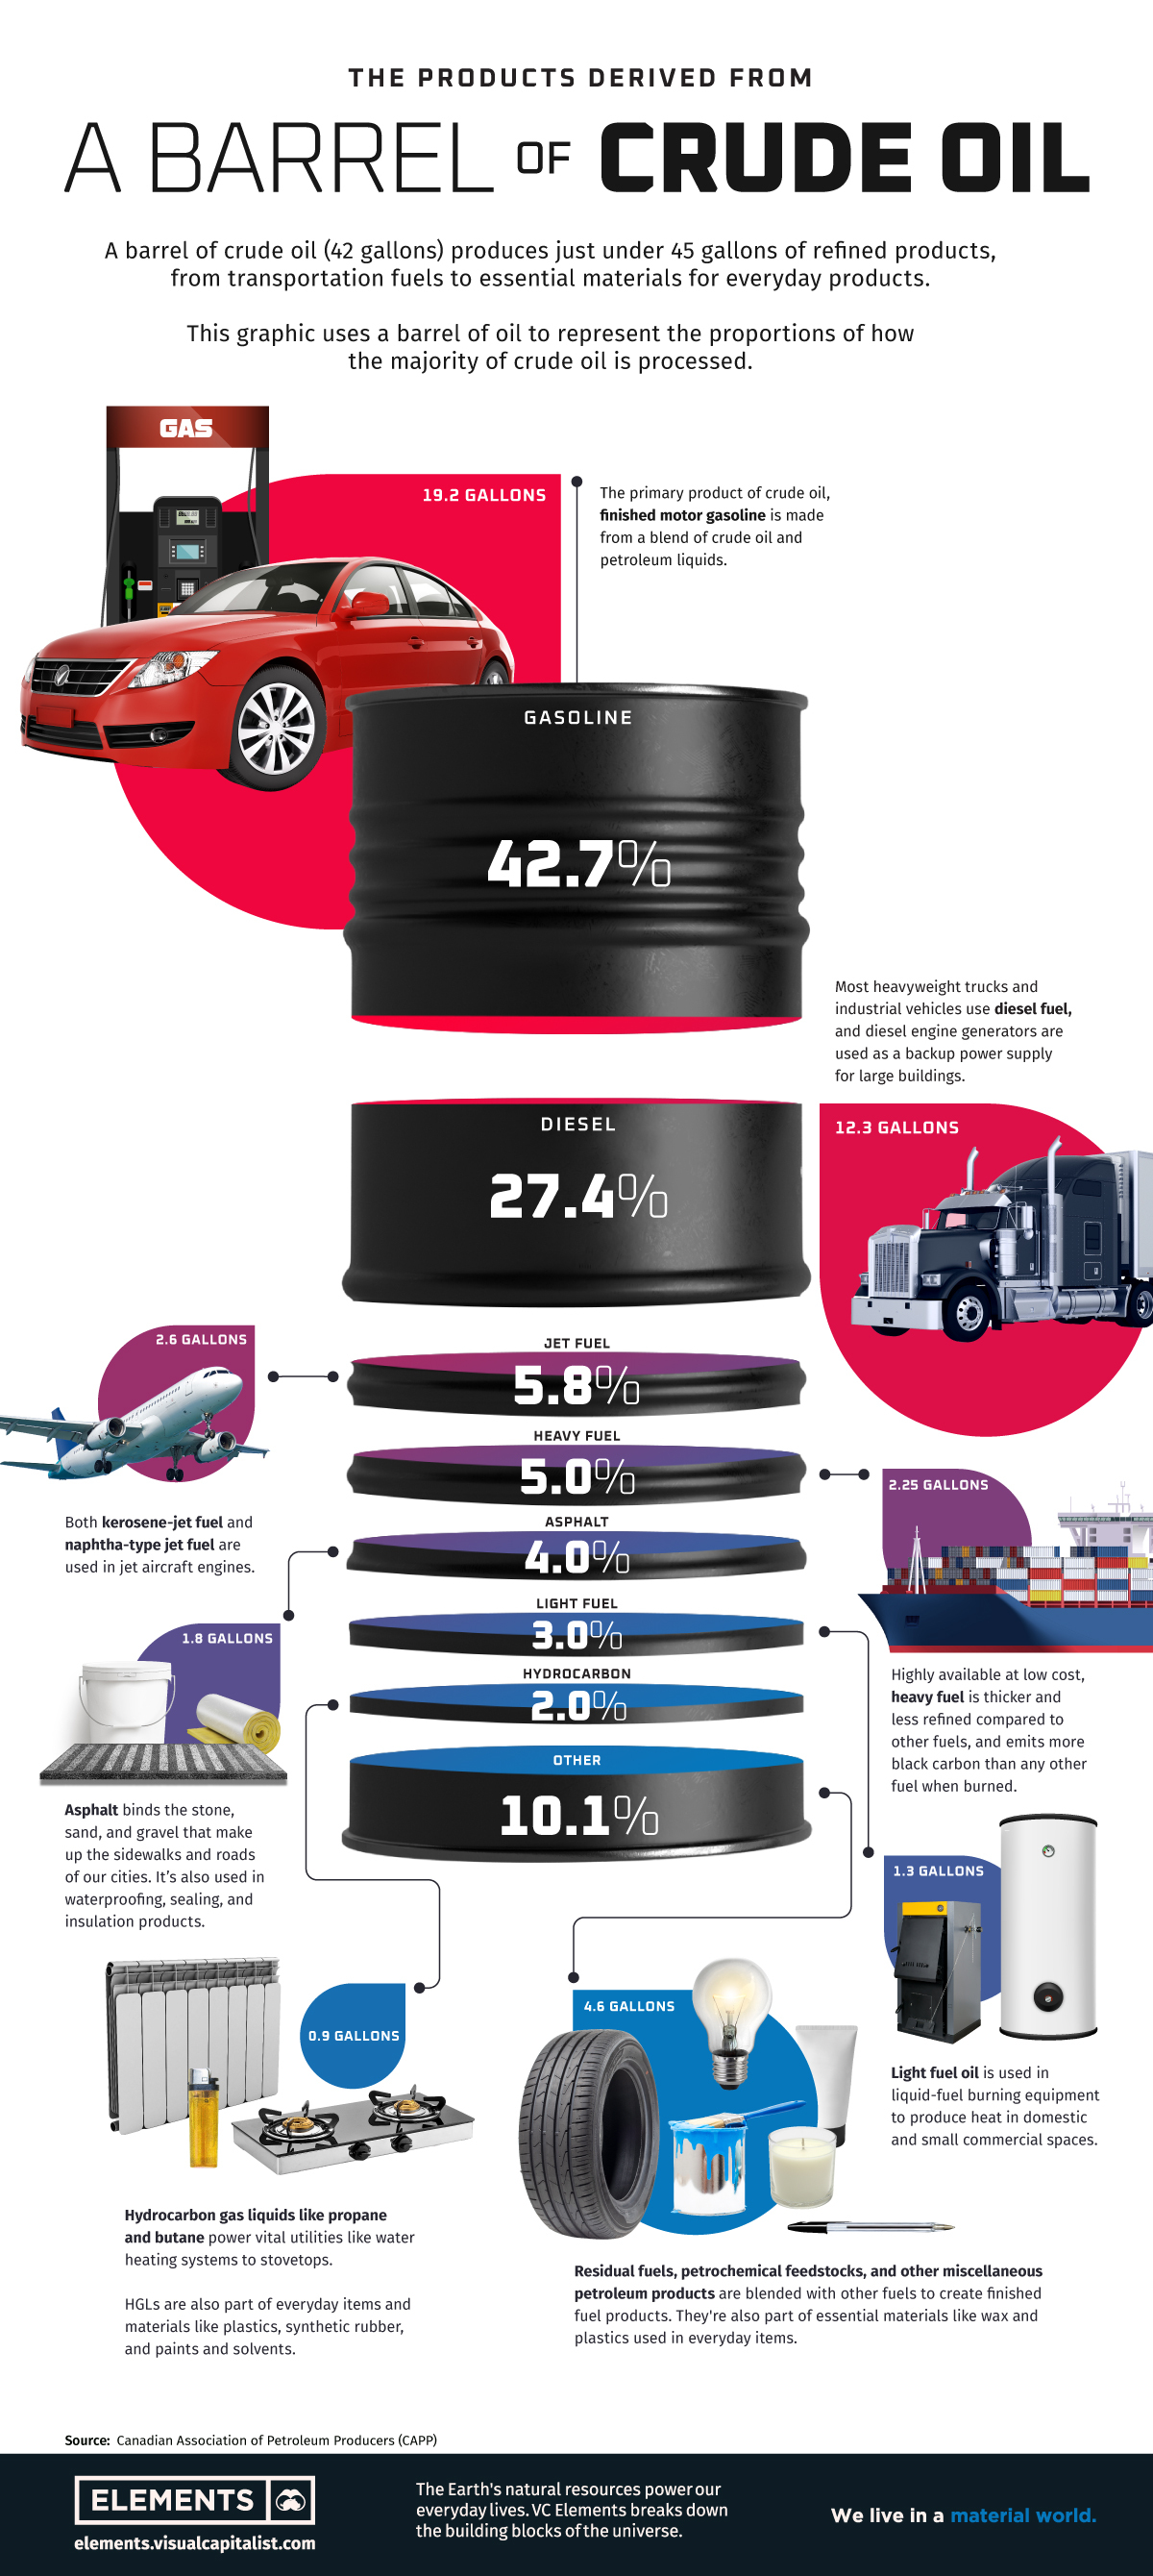
This graphic visualizes how much crude oil is refined into various finished products, using a barrel of oil to represent the proportional breakdown.
Barrel of Oil to Functional Fuel and More
Crude oil is primarily refined into various types of fuels to power transport and vital utilities. More than 85% of crude oil is refined into fuels like gasoline, diesel, and hydrocarbon gas liquids (HGLs) like propane and butane.
Along with being fuels for transportation, heating, and cooking, HGLs are used as feedstock for the production of chemicals, plastics, and synthetic rubber, and as additives for motor gasoline production.
| Refined Crude Oil Product | Share of Crude Oil Refined |
|---|---|
| Gasoline | 42.7% |
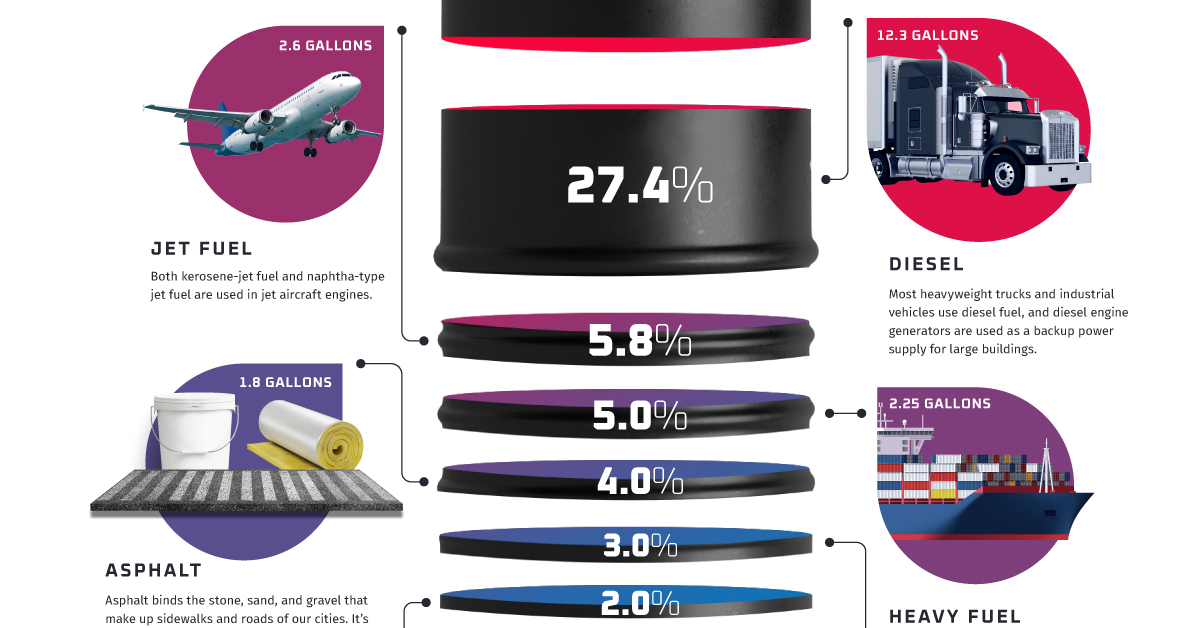
| Diesel | 27.4% |
| Jet fuel | 5.8% |
| Heavy fuel | 5.0% |
| Asphalt | 4.0% |
| Light fuel | 3.0% |
| Hydrocarbon gas liquids | 2.0% |
| Other | 10.1% |
Source: Canadian Association of Petroleum Producers
Crude oil not only powers our vehicles, but it also helps pave the roads we drive on. About 4% of refined crude oil becomes asphalt, which is used to make concrete and different kinds of sealing and insulation products.
Although transportation and utility fuels dominate a large proportion of refined products, essential everyday materials like wax and plastic are also dependent on crude oil. With about 10% of refined products used to make plastics, cosmetics, and textiles, a barrel of crude oil can produce a variety of unexpected everyday products.
Personal care products like cosmetics and shampoo are made using petroleum products, as are medical supplies like IV bags and pharmaceuticals. Modern life would look very different without crude oil.
The Process of Refining Crude Oil
You might have noticed that while a barrel of oil contains 42 gallons, it ends up producing 45 gallons of refined products. This is because the majority of refined products have a lower density than crude oil, resulting in an increase in volume that is called processing gain.
Along with this, there are other inputs aside from crude oil that are used in the refining process. While crude oil is the primary input, fuel ethanol, hydrocarbon gas liquids, and other blending liquids are also used.
| U.S. Refiner and Blender Inputs | Share of Total |
|---|---|
| Crude oil | 85.4% |
| Fuel ethanol | 4.8% |
| Blending components | 3.5% |
| Hydrocarbon gas liquids | 3.0% |
| Other liquids | 3.3% |
Source: EIA
The process of refining a 30,000-barrel batch of crude oil typically takes between 12-24 hours, with refineries operating 24 hours a day, 365 days a year. Although the proportions of individual refined products can vary depending on market demand and other factors, the majority of crude oil will continue to become fuel for the world’s transport and utilities.
The Difficulty of Cutting Down on Crude Oil
From the burning of heavy fuels that tarnish icebergs found in Arctic waters to the mounds of plastic made with petrochemicals that end up in our rivers, each barrel of oil and its refined products impact our environment in many different ways.
But even as the world works to reduce its consumption of fossil fuels in order to reach climate goals, a world without crude oil seems unfathomable.
Skyrocketing sales of EVs still haven’t managed to curb petroleum consumption in places like Norway, California, and China, and the steady reopening of travel and the economy will only result in increased petroleum consumption.
Completely replacing the multi-faceted “black gold” that’s in a barrel of oil isn’t possible right now, but as electrification continues and we find alternatives to petrochemical materials, humanity might at least manage to reduce its dependence on burning fossil fuels.


Who’s Building the Most Solar Energy?
This was originally posted on our Voronoi app. Download the app for free on iOS or Android and discover incredible data-driven charts from a variety of trusted sources.
In 2023, solar energy accounted for three-quarters of renewable capacity additions worldwide. Most of this growth occurred in Asia, the EU, and the U.S., continuing a trend observed over the past decade.
In this graphic, we illustrate the rise in installed solar photovoltaic (PV) capacity in China, the EU, and the U.S. between 2010 and 2022, measured in gigawatts (GW). Bruegel compiled the data..
Chinese Dominance
As of 2022, China’s total installed capacity stands at 393 GW, nearly double that of the EU’s 205 GW and surpassing the USA’s total of 113 GW by more than threefold in absolute terms.
| Installed solar capacity (GW) | China | EU27 | U.S. |
|---|---|---|---|
| 2022 | 393.0 | 205.5 | 113.0 |
| 2021 | 307.0 | 162.7 | 95.4 |
| 2020 | 254.0 | 136.9 | 76.4 |
| 2019 | 205.0 | 120.1 | 61.6 |
| 2018 | 175.3 | 104.0 | 52.0 |
| 2017 | 130.8 | 96.2 | 43.8 |
| 2016 | 77.8 | 91.5 | 35.4 |
| 2015 | 43.6 | 87.7 | 24.2 |
| 2014 | 28.4 | 83.6 | 18.1 |
| 2013 | 17.8 | 79.7 | 13.3 |
| 2012 | 6.7 | 71.1 | 8.6 |
| 2011 | 3.1 | 53.3 | 5.6 |
| 2010 | 1.0 | 30.6 | 3.4 |
Since 2017, China has shown a compound annual growth rate (CAGR) of approximately 25% in installed PV capacity, while the USA has seen a CAGR of 21%, and the EU of 16%.
Additionally, China dominates the production of solar power components, currently controlling around 80% of the world’s solar panel supply chain.
In 2022, China’s solar industry employed 2.76 million individuals, with manufacturing roles representing approximately 1.8 million and the remaining 918,000 jobs in construction, installation, and operations and maintenance.
The EU industry employed 648,000 individuals, while the U.S. reached 264,000 jobs.
According to the IEA, China accounts for almost 60% of new renewable capacity expected to become operational globally by 2028.
Despite the phasing out of national subsidies in 2020 and 2021, deployment of solar PV in China is accelerating. The country is expected to reach its national 2030 target for wind and solar PV installations in 2024, six years ahead of schedule.

-

 Markets5 days ago
Visualizing Global Inflation Forecasts (2024-2026)
-

 Green2 weeks ago
The Carbon Footprint of Major Travel Methods
-

 United States2 weeks ago
Visualizing the Most Common Pets in the U.S.
-

 Culture2 weeks ago
The World’s Top Media Franchises by All-Time Revenue
-

 voronoi1 week ago
Best Visualizations of April on the Voronoi App
-

 Wealth1 week ago
Charted: Which Country Has the Most Billionaires in 2024?
-

 Business1 week ago
The Top Private Equity Firms by Country
-

 Markets1 week ago
The Best U.S. Companies to Work for According to LinkedIn