The LNG market has been on a wild ride across the last 3 years, swinging from boom (2018) to bust (2019-20) and back again (2021). These market swings, strong supply growth and the growing role of new market players are driving a transformation of the LNG market.
“There is no textbook to follow on LNG risk management”
The pace of market evolution has seen rapid growth in physical cargo trading & forward liquidity, as well as rising complexity of contracts, portfolios & supply chains.
Despite this rapid evolution, the LNG market is still emerging from the ‘Wild West’ of global commodity markets and it has its own unique set of market conventions, supply chain logistics and complexity.
This leaves LNG Risk and Middle Office teams facing some interesting challenges. These challenges also have a major impact on front office trading teams that need timely sign off and mark to market of deals to support P&L generation. There is no textbook to follow on LNG risk management and product control.
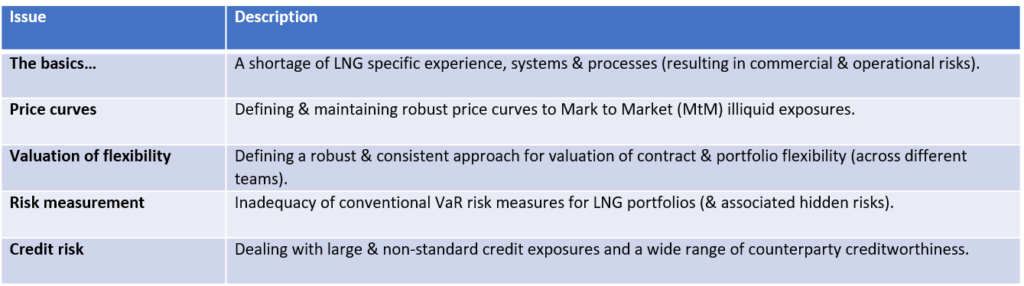
In today’s article we set out 5 key challenges facing LNG Risk and Middle Office (Product Control) teams (summarised in Table 1 below). We also look at a practical numerical case study measuring the portfolio risk impact of adding a US tolling contract to a base LNG portfolio.
1.The basics
People: There are a lot of smart people working in the LNG market. But rapid growth has meant it is currently tough to hire the right expertise, with a real shortage of LNG specific Risk and Middle Office experience.
Systems & data: LNG portfolios involve complex contractual and operational data. This is owned and managed across multiple teams (e.g. LNG Front Office, Chartering / Shipping ops, Middle Office, Risk and Back Office) and different systems & models (e.g. market data / pricing, contract management, ETRM, shipping, portfolio optimisation, valuation & risk). Effective interfaces across these systems and a lack of standardised data models are particular issues.
Processes: As a result of both factors above, there is often not enough resource or time to implement and refine basic processes. This can lead to major manual steps / inefficiencies and associated operational risk.
Let’s consider a practical example. LNG portfolio optimisation requires consistent application of an ‘up to date’ view of all contract and operational data that is managed across different teams (e.g. trading, chartering, shipping ops). Data flow & process issues, e.g. an inaccurate vessel position or an unrecorded change to a cargo delivery window, can render a portfolio optimisation worthless.
2.Price curves
The LNG market is anchored by several liquid pricing points (e.g. TTF, JKM, Henry Hub). But most LNG portfolios have large illiquid exposures that require price curves for:
- Illiquid LNG price points (e.g. NW European DES, US FOB, West India Marker)
- Longer dated exposures beyond the liquid forward curve horizon (which may require ‘mark to model’ vs ‘mark to market’).
Development of these illiquid price curves requires a strong commercial understanding of the market drivers of price basis & long-term pricing. This information usually sits more within Front Office teams rather than Risk and Middle Office.
Illiquid curves are usually built off a liquid curve plus a defined basis relationship. Basis calculations are driven by netback (or net forward) logic from liquid price points, but this involves often complex and subjective shipping cost calculations (e.g. incorporating freight rates, vessel characteristics, voyage assumptions and treatment of sunk costs).
Let’s consider a simple example of price basis dynamics. The key LNG price node in Europe is the NW European DES marker. Depending on market conditions, NWE DES can price on a TTF – cost basis or it can price based on a netback to Asian spot (when cargo reloads are ‘in the money’). In other words the curve can be modelled as the maximum of 1. TTF – cost and 2. JKM – NWE reload to Asia.
3.Valuation of flexibility
There is currently a rapid evolution in the sophistication of valuing flexibility in LNG contracts and portfolios. Accurate valuation and monetisation of flex is a key source of commercial advantage.
When traders pay for extrinsic value (e.g. in a contract), it creates a natural pressure on Middle Office & Risk teams to recognise that value to avoid booking a significant ‘day 1 loss’.
This creates a requirement for a consistent valuation approach across different teams (Front Office, Middle Office & Risk), allowing a focus on differences in assumptions not inconsistencies in modelling methodology. This is a strong argument for implementing a consistent valuation model across teams. A healthy relationship between Trading and Risk teams starts with a common understanding of portfolio exposures.
Many of the challenges with LNG flex valuation come from trying to adapt tools or systems designed for other purposes. For example, traditional pipeline gas flex models and Energy Trading & Risk Management (ETRM) systems typically do a poor job when valuing LNG contracts. An LNG specific valuation model is required that 1. represents how the contract will be managed in practice and 2. captures held and sold flexibility.
Perhaps the most important ‘curve ball’ with LNG flex valuation is portfolio value interdependencies. With traditional mark to market valuation, portfolio value is equal to the sum of the parts. This is not the case for LNG portfolios, where the sum of standalone asset values can be substantially less than that of the combined portfolio.
4.Risk measurement
Traditional ‘Value at Risk’ (VaR) has some important limitations in its application for LNG portfolios. For example:
- A VaR holding period across a number of days is somewhat meaningless for structural and illiquid positions that cannot be liquidated
- The ability to reoptimise and hedge LNG portfolios to manage risk is not well captured in VaR calcs
The limitations of VaR combine to create ‘hidden’ (unmeasured) risk exposures that can often measure in hundreds of millions of dollars for large LNG portfolios.
The emerging best practice to deal with this is to supplement VaR with Earnings (or Cashflow) at Risk measures, supplemented with appropriate stress tests. This also facilitates the calculation of risk capital requirements to support commercial activity.
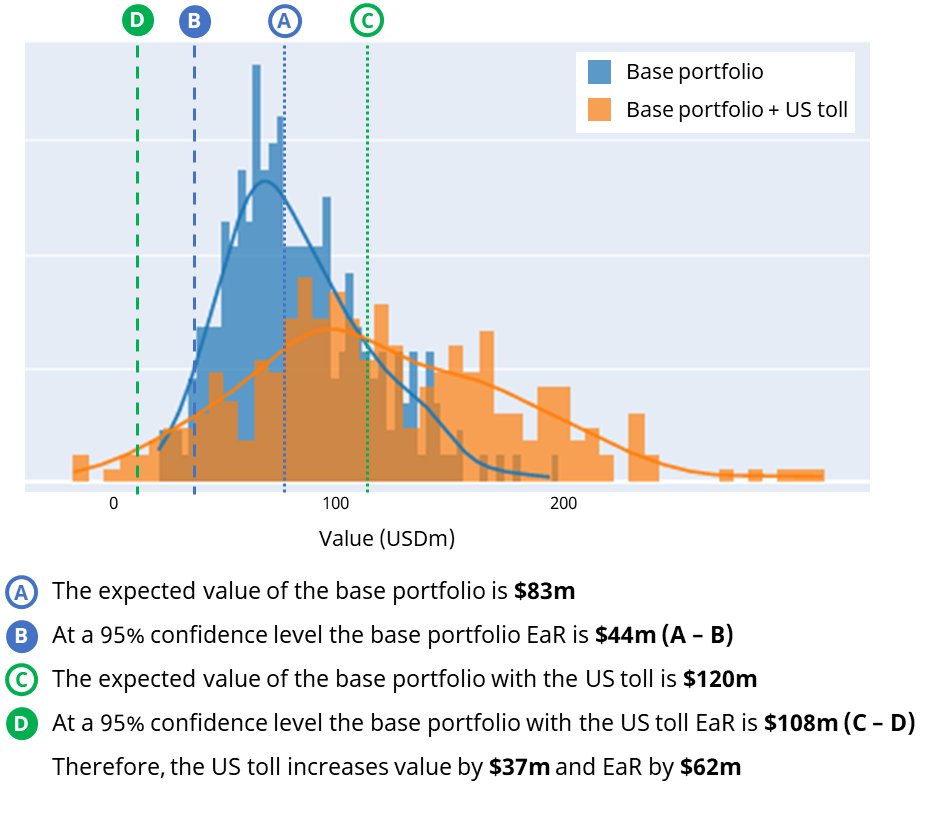
Earnings at Risk (EaR) is a powerful technique to measure LNG portfolio risk. EaR measures the potential variability of asset earnings from expectations, over a longer time horizon (e.g. 1 year). We illustrate an EaR case study in Chart 1.
This case study covers:
- A Base portfolio consisting of 2 Asian sale SPAs (oil indexed), 2 Pacific FOB purchases (oil indexed), European regas (linked to TTF), covering 36 firm cargoes.
- The addition of a US tolling contract covering up to 18 cargoes with price linked to Henry Hub.
To analyse the case study, we have used our LNG Bridge model, which has an EaR engine.
Chart 1 shows EaR for the Base portfolio of $44m across a 1 year horizon (versus an expected portfolio value of $83m). Adding the US toll increases expected portfolio value (to $120m), but also portfolio risk (EaR rises by $62m to $108m).
The additional risk is the result of adding a substantial Henry Hub linked exposure to a Base portfolio dominated by oil-indexed contracts. Low correlation between Henry Hub (HH) and oil prices acts to increase portfolio risk, but it is important to note that this can be significantly mitigated via hedging against liquid Brent and HH forward curves.
EaR is well suited to LNG portfolios because it:
- captures complexity of the physical portfolio (including shipping)
- allows overlay of portfolio optimising and hedging actions (which help to monetise extrinsic value and reduce risk)
- can incorporate price simulation logic capturing fundamental & proxy price relationships.
5.Credit risk
Last but not least comes credit risk. LNG portfolios typically have substantial value locked up in cargoes ($20-50+ million per cargo) and contracts. There is also a big range of creditworthiness & credit processes across counterparties, particularly across emerging market buyers.
Key credit exposures include:
- After signing a deal, before title transfer – here the focus is on cargo replacement cost in case of default
- After title transfer, before payment – here the focus is on cash loss in case of default (inc. credit netting impact).
These issues are important for both seller (not getting paid) and buyer (replacement optimisation vs default).
The Earnings / Cashflow at Risk methodology we set out above is also a powerful tool to measure & manage credit risk. It supports robust calculation of Potential Future Exposure (PFE) levels that can be used to price credit, set limits and manage exposures.
3 other challenges
We’ve set out our ‘top 5’ challenges above but there are 3 other ‘worthy mentions’: 1. FX (and interest rate) risk management (e.g. arising from non USD indexation), 2. Cashflow management (e.g. misalignment of cargo payments / receipts vs products used to hedge) and 3. Financial reporting treatment of LNG contracts, hedges & vessel charters.
See here for more details on our LNG Bridge portfolio valuation model