-
Understanding A Standard Deviation Chart
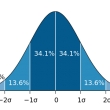
Here is a quick overview for an understanding a standard deviation chart data set. You can see how the examples of the data will fall within one standard deviation of the mean for approximately 68% of the data set, staying within two standard deviations happen with approximately 95% of the data set sampled, and all the data samples will usually fall within three standard deviations approximately 99.7% of the time. The standard deviation identified on the chart as σ (the Greek letter sigma) is the square root of the variance of X, this is the square root of the average value of (X − μ)2. The standard deviation of a ... (full story)
- Story Stats
- Posted: Aug 7, 2020 11:40pm
- Submitted by:Category: Educational NewsComments: 0 / Views: 9,584