
Advertisement
Advertisement
Crude Oil Price Update – Finishing Under $35.49 Forms Potentially Bearish Closing Price Reversal Top
By:
The direction of the July WTI crude oil market is likely to be determined by trader reaction to Friday’s close at $35.49.

U.S. West Texas Intermediate crude oil is under pressure on Monday after posting a stellar return in May. Renewed tension between the United States and China are behind the selling pressure. Early in the session, the market traded higher on reports that OPEC and Russia were closer to a deal on extending oil cuts.
At 13:43 GMT, July WTI crude oil futures are trading $34.61, down $0.88 or -2.48%.
Tension between the U.S. and China escalated on Monday after Beijing ordered major state-run firms to pause some purchases of U.S. farm goods, including soybeans, Bloomberg News reported.
On the positive side, OPEC and Russia, part of a group known as OPEC+, are moving closer to a compromise on the duration for extending oil output cuts and were discussing rolling over the curbs one to two months, two OPEC+ sources told Reuters.
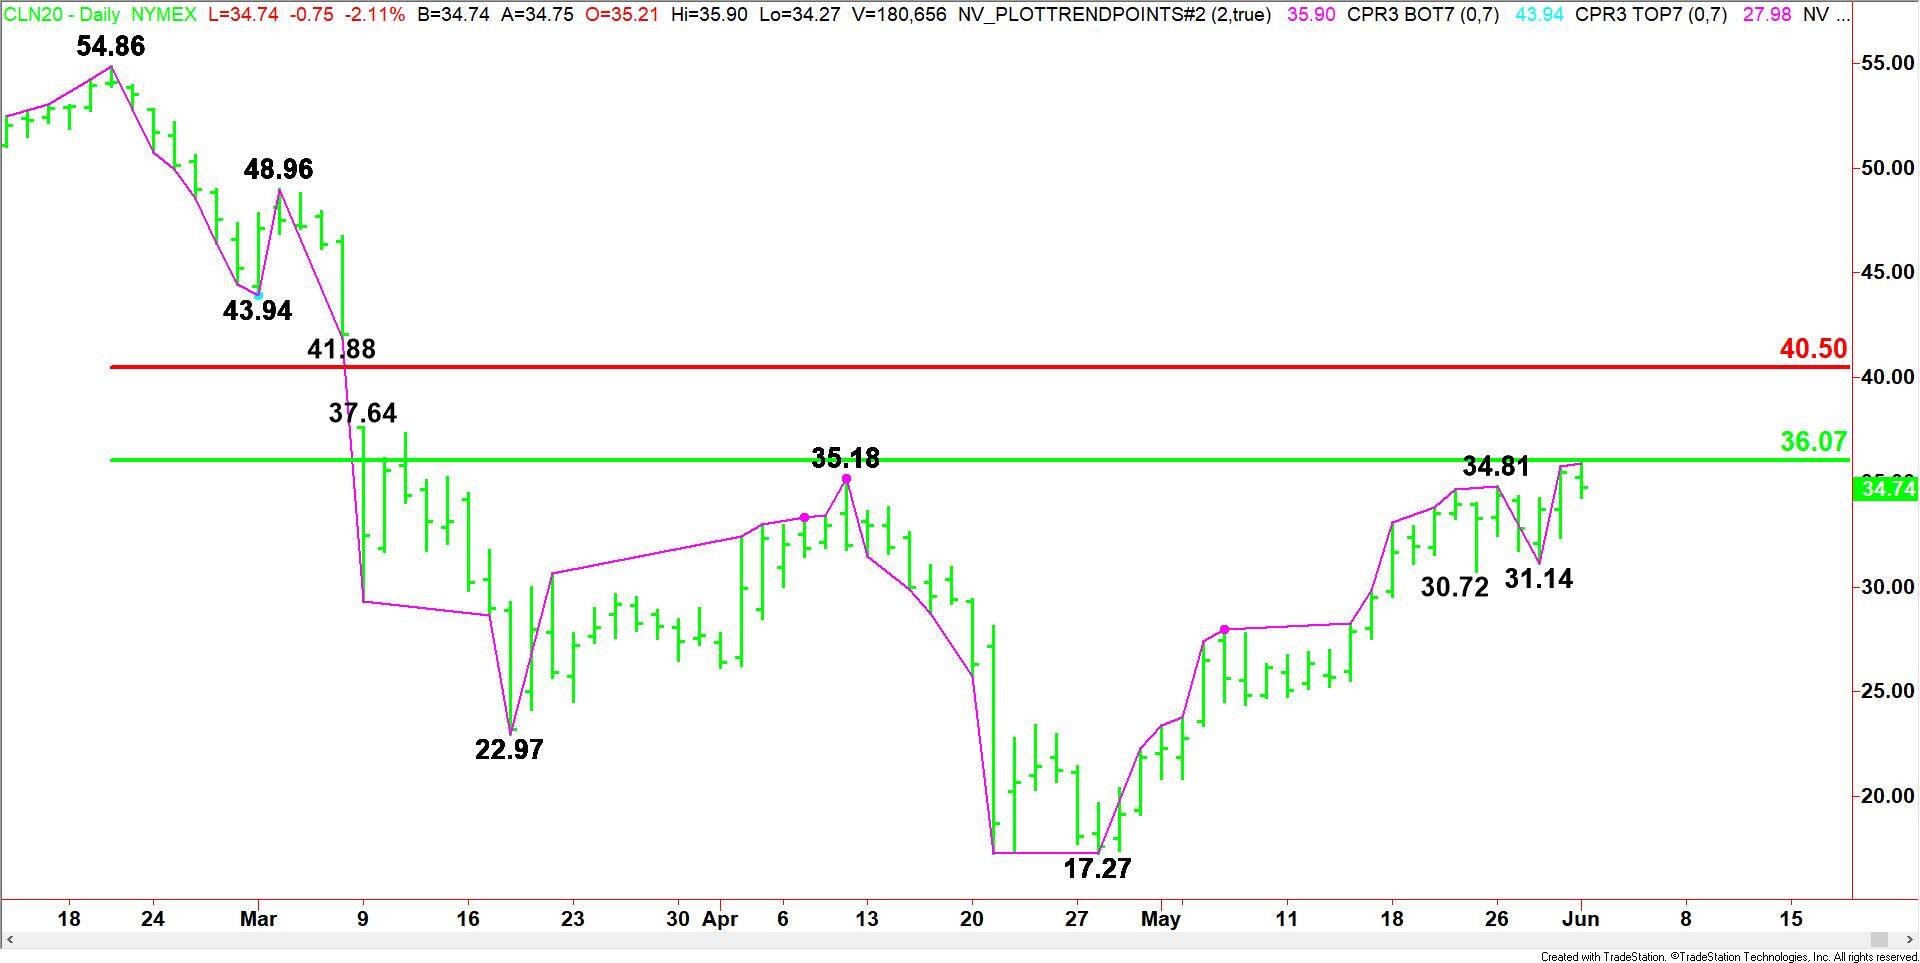
Daily Swing Chart Technical Analysis
The main trend is up according to the daily swing chart. The uptrend was reaffirmed earlier today when buyers took out Friday’s high. A trade through $31.14 will change the main trend to down.
The minor trend is also up, however, turning lower for the session has put the market in a position to form a potentially bearish closing price reversal top. A confirmation of the chart pattern could lead to a 2 to 3 day correction, or even a change in trend if the follow-through selling is strong enough.
The main range is $54.86 to $17.27. Its retracement zone at $36.07 to $40.50 is the primary upside target. This zone is potential resistance. It is also controlling the longer-term direction of the market.
Daily Swing Chart Technical Forecast
Based on the early price action, the direction of the July WTI crude oil market the rest of the session on Monday is likely to be determined by trader reaction to Friday’s close at $35.49.
Bearish Scenario
A sustained move under $35.49 will indicate the presence of sellers. If this move continues to generate enough downside momentum then look for a short-term move into $31.14. A trade through this level will change the main trend to down.
Bullish Scenario
A sustained move over $35.49 will signal the presence of buyers. The first upside target is the major 50% level at $36.07. Overtaking this level will indicate the buying is getting stronger. This could lead to an eventual test of the major Fibonacci level at $40.50.
For a look at all of today’s economic events, check out our economic calendar.
About the Author
James Hyerczykauthor
James is a Florida-based technical analyst, market researcher, educator and trader with 35+ years of experience. He is an expert in the area of patterns, price and time analysis as it applies to futures, Forex, and stocks.
Did you find this article useful?
Latest news and analysis


Advertisement