
Advertisement
Advertisement
Natural Gas Soars: Bullish Momentum Indicates Potential for Further Gains
By:
Analyzing the current natural gas rally, it's reminiscent of the August 2 surge, hinting at the possibility of a 22.8% rise. We're already up 11.3% in four days, but can it match the previous performance?

In this article:
Natural Gas Forecast Video for 13.09.23 by Bruce Powers
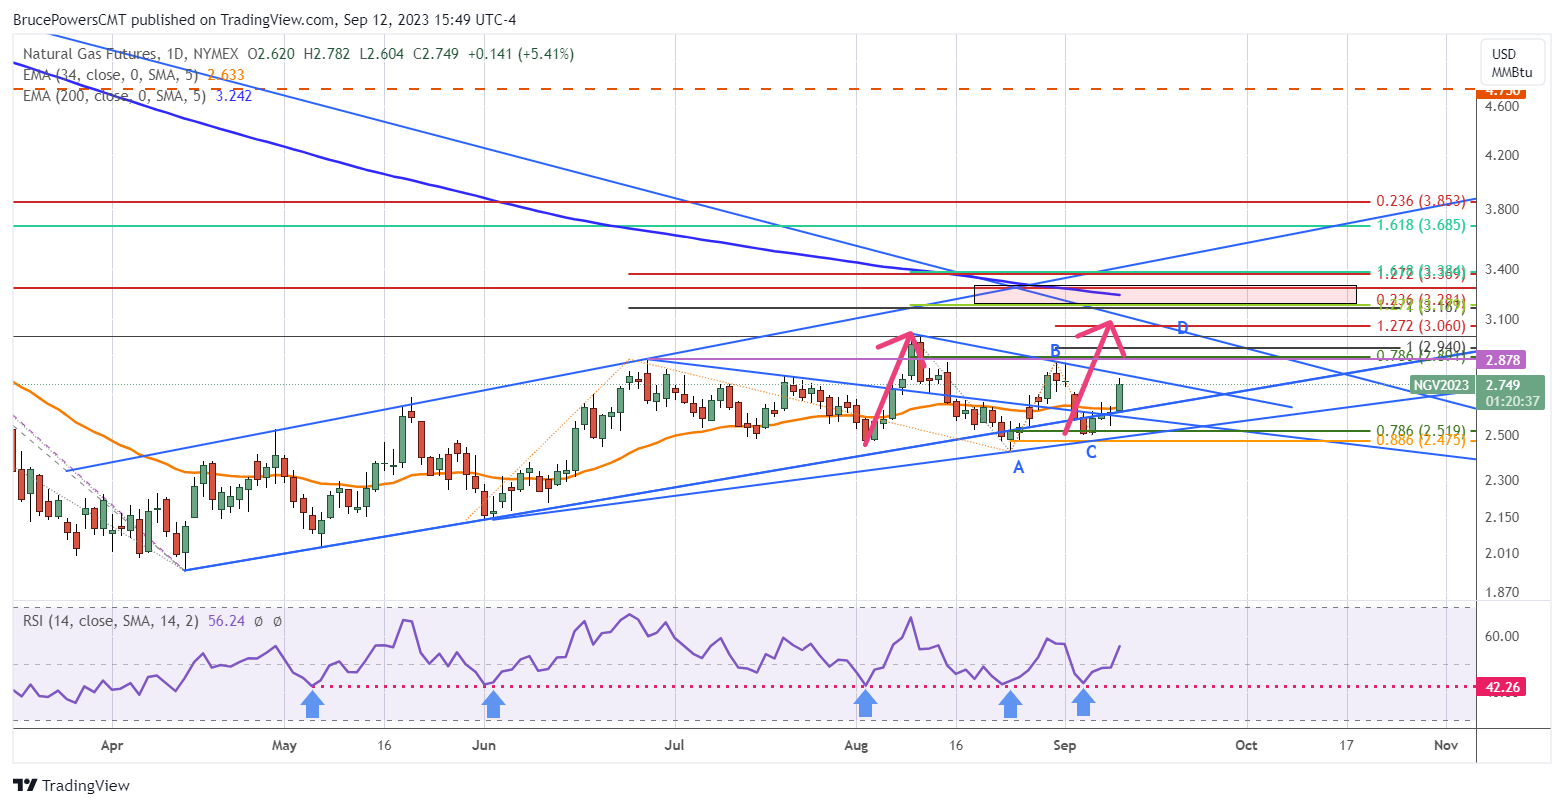
Natural gas breaks out of yesterday’s bullish doji hammer candlestick pattern on a move above 2.64. Upward momentum subsequently kicked in generating a long-range green candle. It has reached a high of 2.78 at the time of this writing yet remains strong. And it is on track to close in the top quarter of the day’s range.
Accumulation Signs Suggest Growing Bullish Sentiment
Today’s low to high measures a 6.8% range. That range is similar to the first strong momentum move that was seen coming off the August 2 bottom. As natural gas started to rise it had a 7.1% range day on August 7. This is what we would like to see to confirm growing bullish sentiment. As price comes off the bottom buyers aggressively accumulate. Such accumulation doesn’t just take place in one day. It can be an early sign to a pattern of accumulation that can help to propel prices higher.
Measured Move Shows Potential to Match August’s 22.8% Advance
There is the potential for the current rally to at least match the measured move starting from the August 2 low. That advance saw natural gas rise by as much as 22.8% in five days. We are already in the fourth day of the current advance with natural gas rising as much as 11.3% as of today’s high. That’s about half of the potential performance if we are to see a match in the two swings. On a percentage basis the current rally will match at 3.08. That target is very close to the 3.06 target for a rising AB equals CD pattern (ABCD).
ABCD Pattern targets at 2.94, 3.06 (127.2%), and 3.21 (161.8%)
The ABCD pattern is not drawn on the chart for the sake of visual clarity, but the labels are. They show the swing lows and highs that make up the pattern. This pattern looks for the current leg up in the uptrend (CD) to match the price appreciation in the first (AB). In the current case, that occurs at 2.94. That price is also a target but when we add the Fibonacci extensions of 127.2% and 161.8% to the length of the AB leg, we get two additional targets that are related to the AB leg by Fibonacci ratios to use to measure targets for the CD leg. The extended CD targets for natural gas are 3.06 (127.2%) and 3.21 (161.8%).
For a look at all of today’s economic events, check out our economic calendar.
About the Author
Bruce Powersauthor
Bruce boasts over 20 years in financial markets, holding senior roles such as Head of Trading Strategy at Relentless 13 Capital and Corporate Advisor at Chronos Futures. A CMT® charter holder and MBA in Finance, he's a renowned analyst and media figure, appearing on 150+ TV business shows.
Did you find this article useful?
Latest news and analysis


Advertisement